Figure 8.

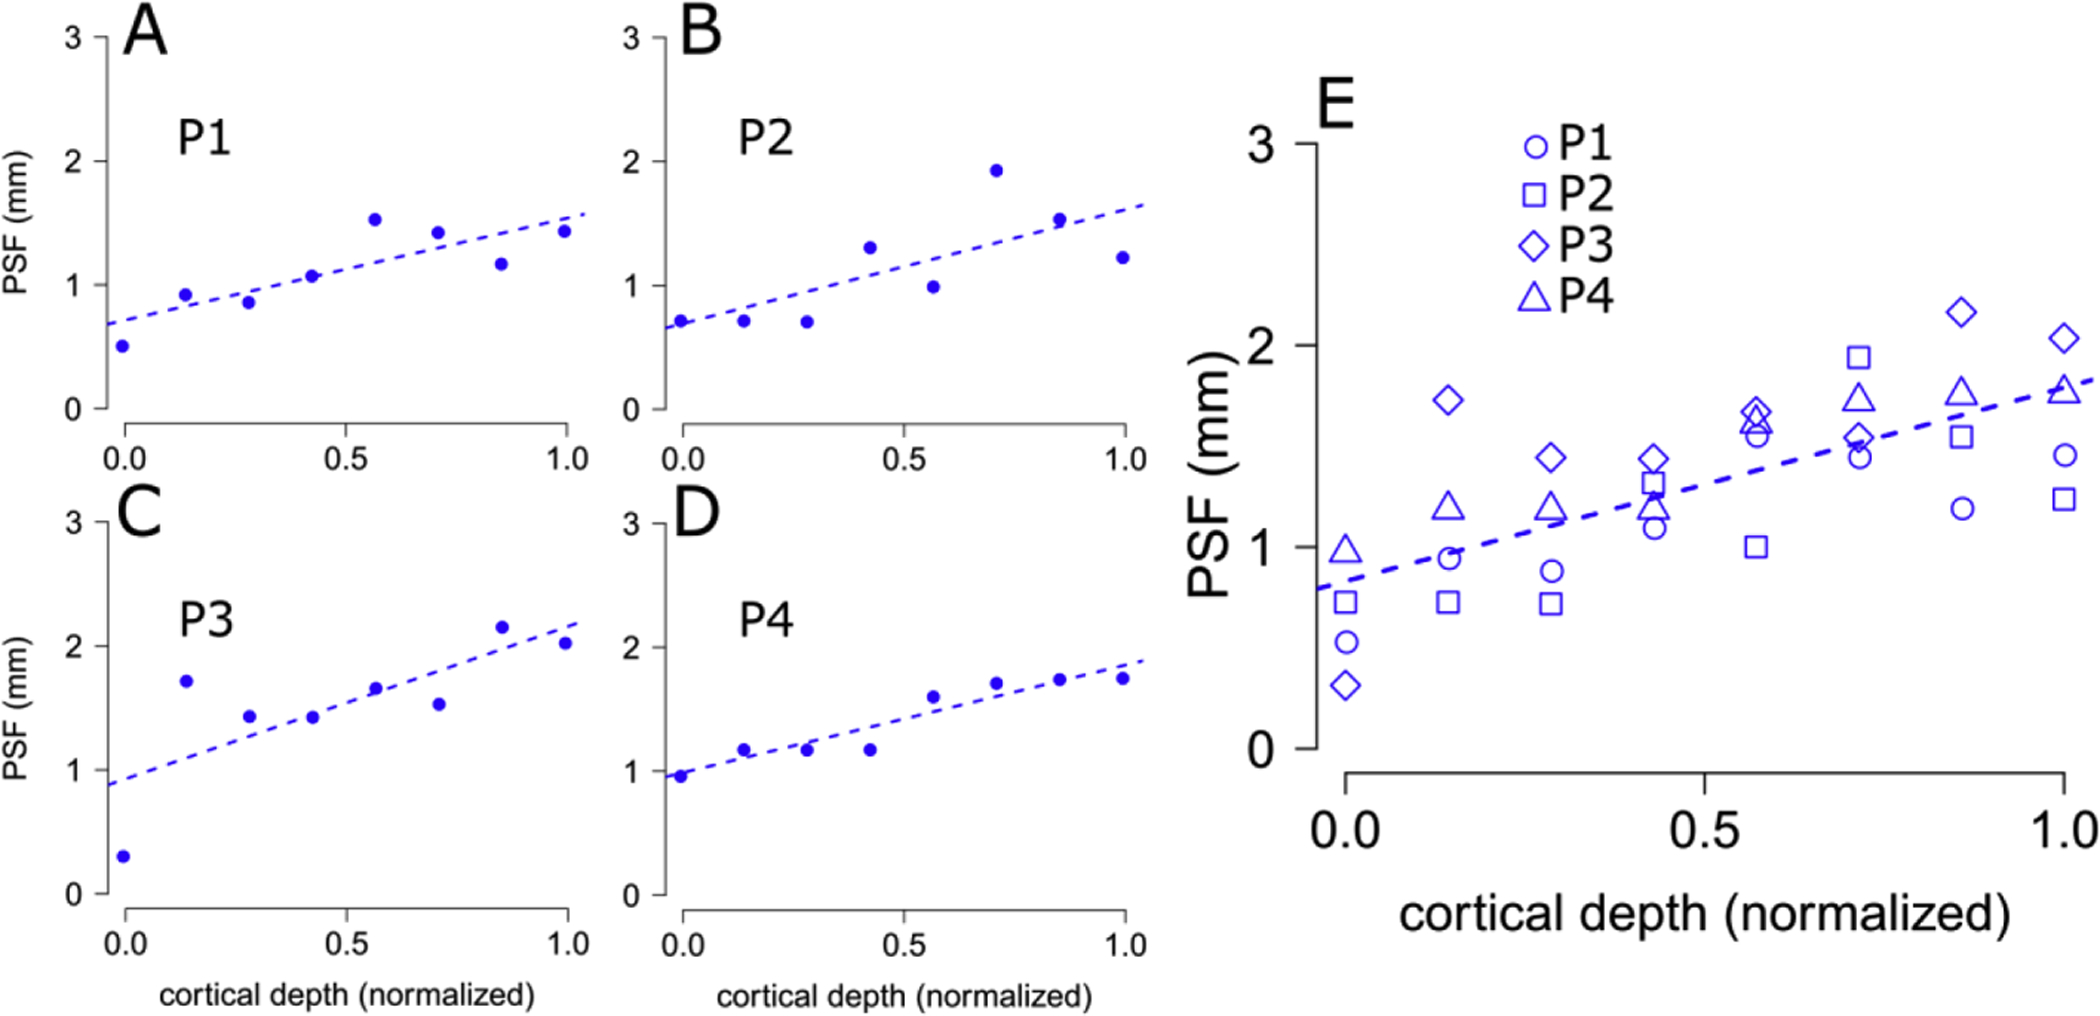
PSF estimates across cortical depth. Panels A-D, PSF estimates for GE-BOLD across cortical depth (x-axis: 0.0, WM surface, 1.0 GM/CSF border), for each participant (P1–P4), dotted lines indicate best fitting linear relations based on least-square estimation. Panel E. same as A-D, with all participants grouped together. This plot indicates that BOLD PSF is maximal in the superficial part of the cortex, and it decreases with increasing cortical depth. GE-BOLD PSF range from 0.83 mm close to the WM-GM border, to 1.78 mm close to CSF (see Table 1).
