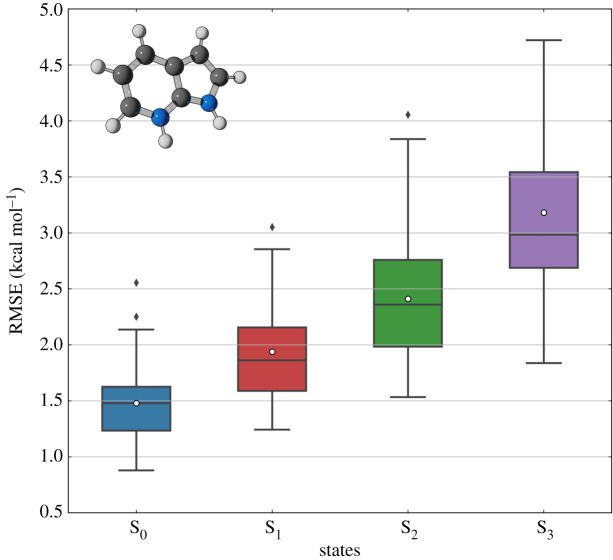
Figure 2.
Assessment of KREG model uncertainty for predicting ground- and excited-state energies of an entire surface hopping trajectory of protonated 7-azaindole. Each boxplot contains the distribution of RMSE values of energy predictions for one entire trajectory (test set) out of 50 independent MD simulations. The model was trained on 5000 molecular geometries randomly sampled from 49 trajectories after separating one trajectory for testing. This process was repeated until each one of the 50 MD trajectories were evaluated. The white dots in the boxplots represent the mean value of the RMSE distribution, while black dots indicate the outliers. (Online version in colour.)

