Figure 4.

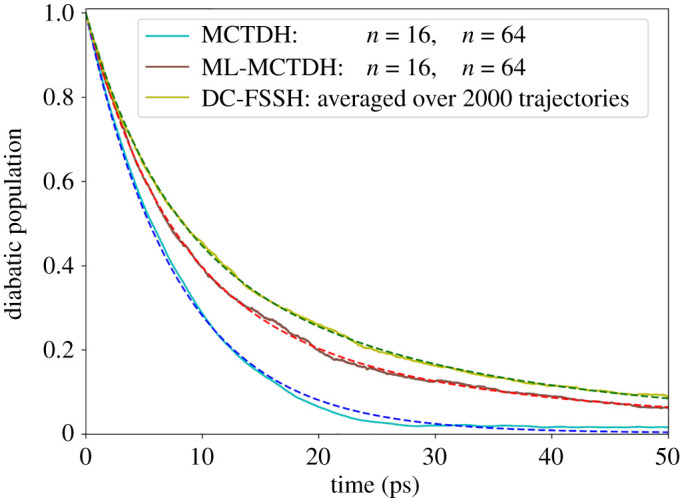
The diabatic population decay of the excited state for different dynamics methodologies are shown in solid lines, and the corresponding fitted curves are presented in dashed lines. (Online version in colour.)

The diabatic population decay of the excited state for different dynamics methodologies are shown in solid lines, and the corresponding fitted curves are presented in dashed lines. (Online version in colour.)