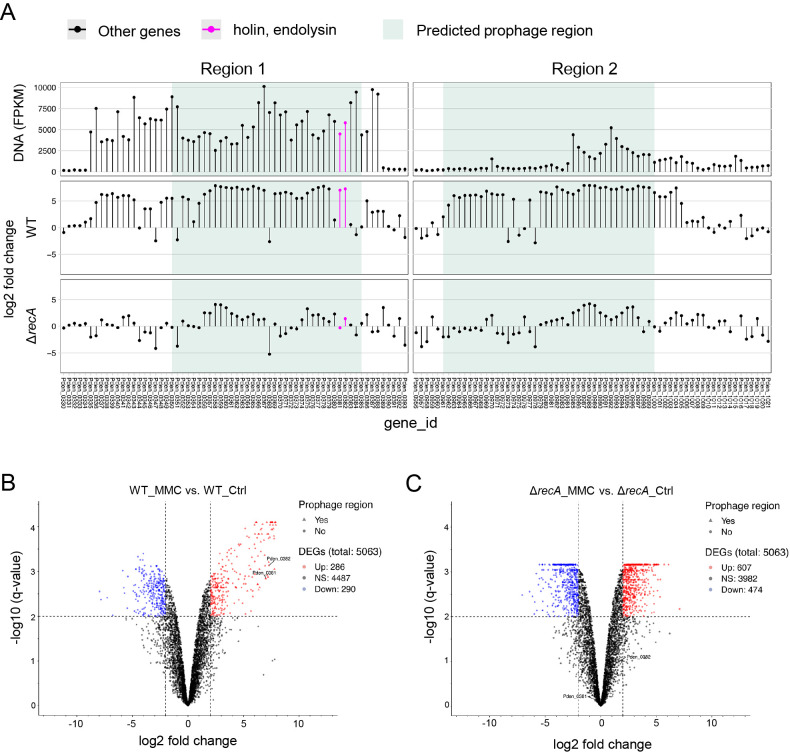
Fig. 3.
Induction of Pden_0381 and Pden_0382 revealed by DNA-seq and RNA-seq.
(A) Green shading indicates regions 1 and 2 as prophage regions predicted using PhiSpy. Dots represent the transcripts of each gene. (B, C) Volcano plot showing the results of an analysis of differential expression between (B) WT with MMC vs. WT without MMC and (C) ΔrecA with MMC vs. ΔrecA without MMC. The vertical axis (y-axis) corresponds to the mean expression value of log 10 (q-value), and the horizontal axis (x-axis) represents the log2 fold-change value. Genes above the thresholds have been highlighted in color: red and blue dots represent transcripts whose expression was up-regulated and down-regulated, respectively. The black dots indicate no significant change, positive x-values represent up-regulation, and negative x-values represent down-regulation. Lists of genes are provided in Tables S3 and S4.

