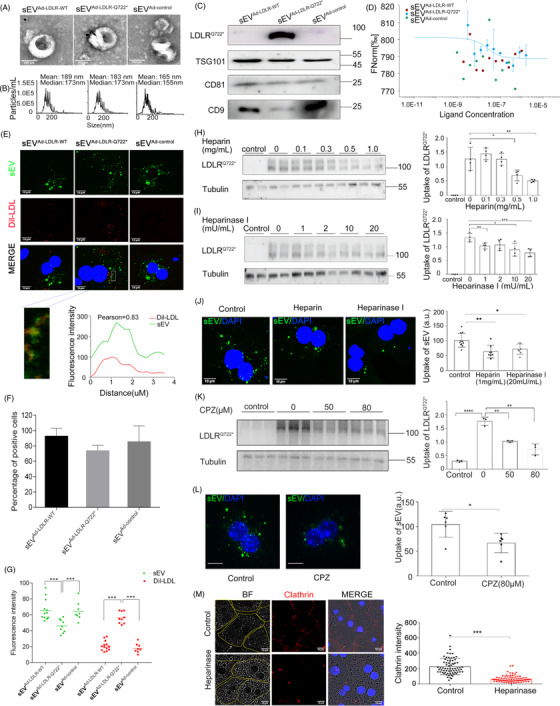
FIGURE 2.

Heparan sulphate proteoglycans and clathrin mediated the endocytosis of small extracellular vesicles containing LDLRQ722*. (A) Transmission electron microscopy (TEM) image of sEV which isolated from the supernatant of HepG2 infected with Ad‐LDLRWT, Ad‐LDLRQ722* and Ad‐control. Arrowheads indicate 5 nm gold particles after immunogold‐labelled with LDLR antibodies. Scale: 200 nm. (B) Nanoparticle tracking analysis (NTA) of sEV. (C) Western blot analysis of sEV marker proteins CD9, CD81, TSG101 and LDLRQ722*. (D) The binding affinities between sEV and Dil‐LDL were measured using MST. Kd model binding curves are depicted. (E) Ldlr –/– primary hepatocytes were cultured with Dil‐LDL and PKH67‐labeled sEV. Colocalisation of Dil‐LDL and PKH67‐sEV by confocal microscopy. Pearson correlation coefficient (PCC) was employed to quantify colocalisation. sEV(green), DAPI for nuclear (blue), Dil‐LDL (red). Scale: 10 μm. (F) Histograms showing the percent of uptake positive cells/all cells. (G) Intracellular fluorescence intensity of sEV and Dil‐LDL analysed by confocal microscopy. (H) Ldlr –/– primary hepatocytes were incubated without (control) or with SupernatantsAd‐LDLR‐Q722* for 2 h in the presence of heparin, LDLRQ722* uptake analysed by the Western Blot. (I) Same experiments as in (H) in the presence of heparinase I. (J) Ldlr –/– primary hepatocytes were incubated with PKH67‐sEV (30 μg/ml) for 4 h in the absence (control) or in the presence of heparin and heparinase I, sEV uptake analysed by confocal microscope. sEV (green), DAPI for nuclear (blue). Scale: 10 μm. (K) Same experiments as in (H) in the presence of chlorpromazine (CPZ), LDLRQ722* uptake analysed by the Western blot. (L) Same experiments as in (H) in the presence of CPZ, sEV uptake analysed by confocal microscope. (M) Same experiments as in (H) and clathrin analysed by confocal microscopy. BF respected bright‐field, yellow line for cell contours, DAPI for nuclear (blue), CY3 for clathrin (red). Scale: 10 μm. Data are expressed as mean ± SD. Statistical analyses, unpaired t test. * p < 0.05; ** p < 0.01; *** p < 0.001
