FIGURE 3.

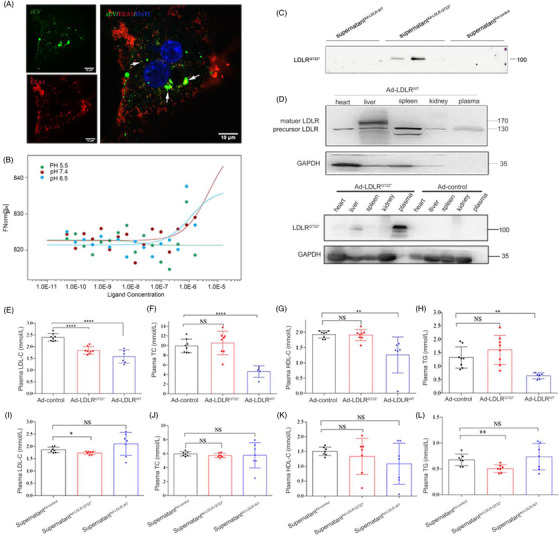
LDLRQ722* reduced plasma LDL‐C levels in Ldlr –/‐ mice. (A) Ldlr –/– primary hepatocytes were incubated with PKH67 labelled sEV for 2 h, colocalisation of sEV and EEA1(a marker of early and intermediate endosome) analysed by confocal microscopy. DAPI for nuclear (blue), CY3 for EEA1 (red). Arrows show example of localisation between sEV and EEA1. Scale: 10 μm. (B) The binding affinities between sEVAd‐LDLR‐Q722* and Dil‐LDL were measured using MST. Kd model binding curves are depicted. (C) Ad‐LDLRWT, Ad‐LDLRQ722* and Ad‐control were transfected into HepG2 cell, the supernatantAd‐LDLR‐WT, supernatantAd‐LDLR‐Q722*, supernatantAd‐LDLR‐control were collected. Ldlr –/– primary hepatocytes were incubated in supernatant supplemented with LDL for 2 h, then replace fresh serum‐free medium, analysed for LDLRQ722* secretion in the fresh serum‐free medium after 2 h by the Western blot. (D) Ldlr –/–mice were injected with 200 μl, 5×10¹¹ vp/ml Ad‐LDLRWT (n = 6), Ad‐LDLRQ722* (n = 8) and Ad‐control (n = 8) via tail vein for 2 weeks. Expression of LDLRQ722* in different tissues by the Western blot. (E–H) Plasma LDL‐C, TC, HDL‐C, TG were determined by automatic biochemical analyser. (I–L) Ldlr /– mice were injected with 200 μl supernatant Ad‐control (n = 7), supernatantAd‐LDLR‐Q722* (n = 7) and supernatant Ad‐LDLR‐WT (n = 7) every other day via tail vein for 2 weeks, plasma LDL‐C, TC, HDL‐C and TG were determined. Data are expressed as mean ± SD. Statistical analyses, unpaired t test. * p < 0.05; ** p < 0.01; **** p < 0.0001; NS: not statistically significant
