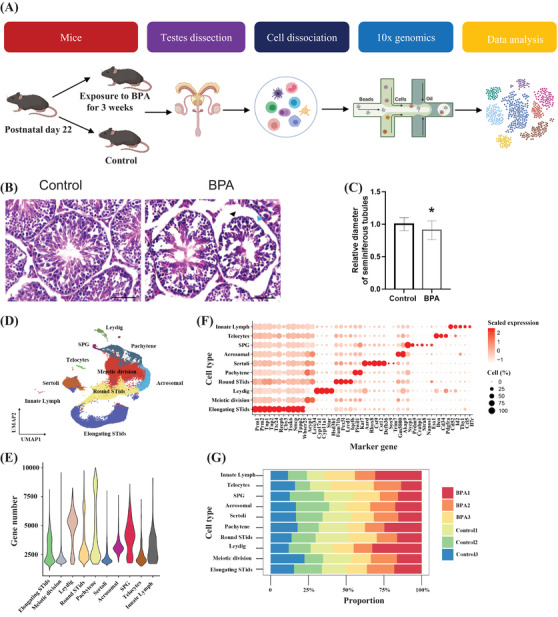
FIGURE 1.

Overall of the experimental design and single‐cell transcriptome analysis of mouse testes upon bisphenol A (BPA) treatment. (A) Schematic model showing the experimental design of this study. (B) Representative Hematoxylin and eosin (H&E) staining images showing BPA‐induced testicular injury in mice. Data were present as mean ± standard error of the mean (SEM) from five mice per group. Wrinkling on the boundaries of seminiferous tubules was shown in black arrows; intensified atrophy and loss of seminiferous tubules were shown in blue arrows. Scale bar 50 μM. (C) Quantification of seminiferous diameter of B. (D) UMAP plot of 77 776 cells from testicular tissue showing 10 major‐coloured clusters of germ cells and somatic cells upon BPA treatment. (E) Violin plot of average gene numbers identified in each cell type. (F) Plot of canonical cell‐type markers in 10 major cell types of the testis. (G) Bar plot of the relative proportions of specified cell types in the testis from untreated and BPA‐treated samples for each cluster
