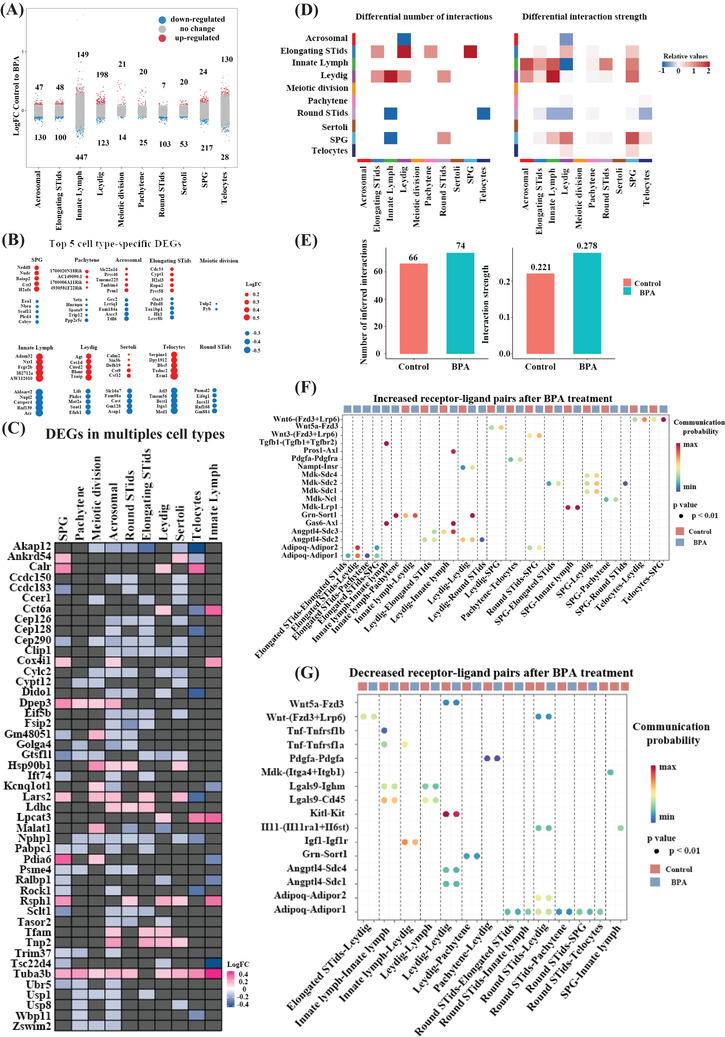
FIGURE 2.

Bisphenol A (BPA)‐associated differently expressed genes (DEGs) in different cell types, and receptor‐ligand pairs changes in the testis. (A) Strip chart showing the BPA‐related changes of all detected genes (dots) across 10 cell types. Red colour showed significantly up‐regulated genes, and blue colour indicated significantly down‐regulated ones. Black colours are not significantly changed upon treatment. (false discovery rate (FDR) < .05 and fold change (FC) > 10%). (B) Cell‐type‐specific top five significantly up‐regulated and down‐regulated genes in different cell types upon BPA treatment. (C) Heat‐map showing differentially expressed genes among different cell types upon BPA‐treatment. (D) Heat‐map plot shows interaction numbers and strength between different cell types upon BPA treatment. (E) Quantification data of interaction numbers and strength in D. (F) Bubble plot shows significantly up‐regulated ligand‐receptor pairs upon BPA treatment. (G) Bubble plot shows significantly down‐regulated ligand‐receptor pairs upon BPA treatment
