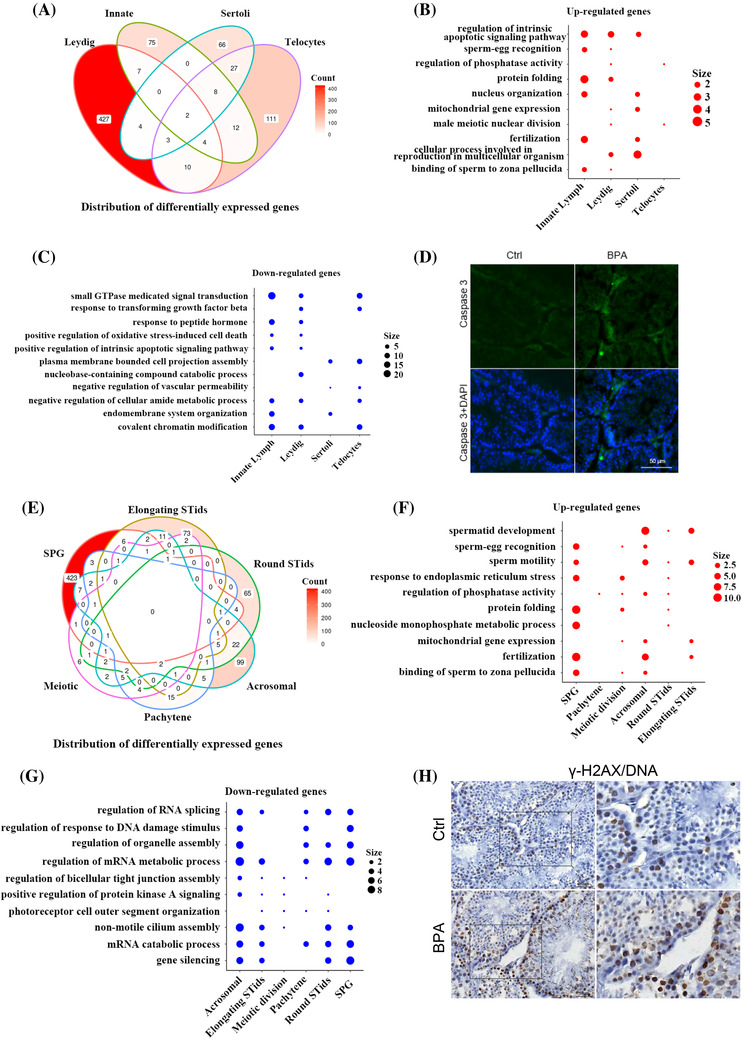
FIGURE 3.

The changes in cellular pathways and processes upon bisphenol A (BPA)‐treatment. (A) Venn diagram showing the distribution of overlapped differentially expressed genes (DEGs) among somatic cell types in the testis upon BPA treatment. (B–C) Representative shared GO terms of up‐regulated (B) and down‐regulated (C) differentially expressed genes in different somatic cell types in the testis upon BPA treatment. (D) Immunofluorescence results showing increased proapoptotic marker Caspase 3. (E) Venn diagram showing the distribution of overlapped DEGs across all the germ cell types in the testis upon BPA treatment. (F–G) Representative shared GO terms of up‐regulated (F) and down‐regulated (G) differentially expressed genes in different germ cell types in the testis upon BPA treatment. (H) Immunofluorescence results showing increased DNA damage marker γ‐H2AX. Size indicates gene number. Data are present as mean ± SEM of three control and three BPA treated testis; *p‐value < .05 and FC > 10% indicate significantly differentially expressed genes and significant GO terms
