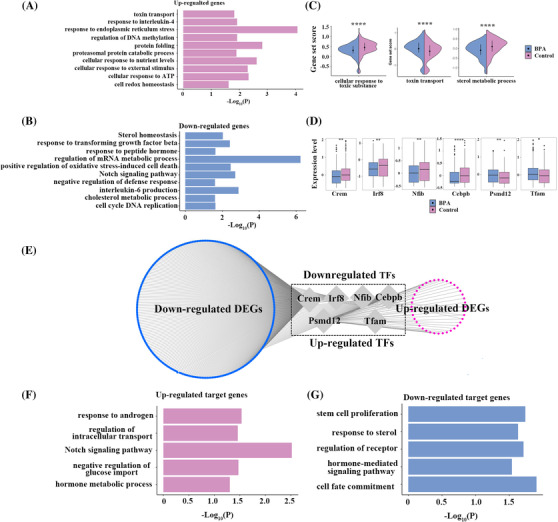
FIGURE 4.

Bisphenol A (BPA) ‐related molecular alterations in Leydig cell. (A–B) Bar plot showing GO terms of up‐regulated (A) and down‐regulated (B) differentially expressed genes in the Leydig cell. (C). Violin plots showing gene set scores of Leydig cell of BPA and Control groups. (D) Box plots showing differentially expressed transcription factor (TF) Crem, Irf8, Nfib, Cebpb, Psmd12 and Tfam between BPA and control groups. (E) Network plot showing the differentially expressed TFs and corresponding differentially expressed target genes in Leydig cell. (F–G) Bar plot showing GO terms of the differentially expressed TFs and corresponding up‐regulated (F) and down‐regulated (G) target genes in Leydig cell. Pink colour showed up‐regulated and blue colour show down‐regulated genes. Data were present as mean ± SEM of three control and three BPA treated testis; *p value < .05 and FC > 10% indicate significantly differentially expressed genes and significant GO terms. *p < .05; **p < .01; ***p < .001; ****p < .0001
