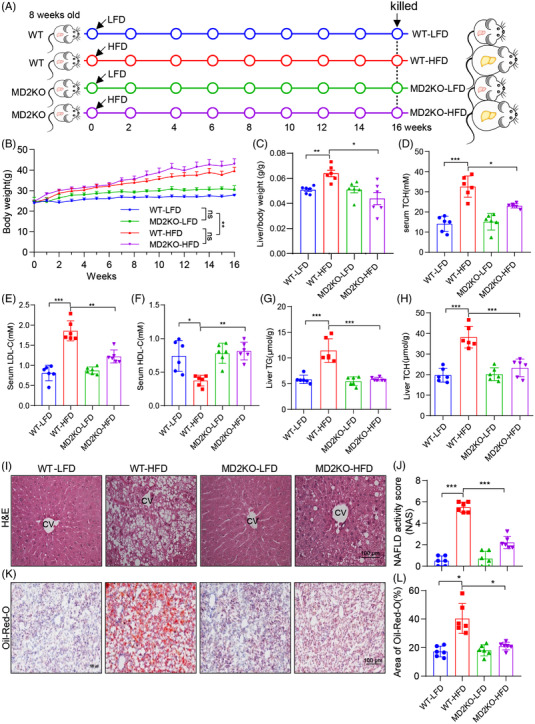
FIGURE 2.

MD2 knockout mice display reduced lipid accumulation in liver tissues when fed a high‐fat diet. (A) The schematic diagram showing the grouping and steps of animal experiments. WT and MD2KO mice were fed with low‐fat rodent diet (LFD) or high‐fat diet (HFD) for 16 weeks. (B) Body weight of mice measured weekly (n = 6; mean ± SEM; ns, not significant; **p < .01]. (C) Ratios of liver weight relative to body weight (LW/BW) at the time of harvest. (D–F) Serum levels of total cholesterol (TCH) (D), low‐density lipoprotein‐cholesterol (LDL‐C) (E) and high‐density lipoprotein‐cholesterol (HDL‐C) (F) in mice. (G and H) Levels of triglyceride (TG) (G) and TCH (H) in liver tissues of mice. (I and J) Assessment of liver injury as determined by hematoxylin and eosin (H&E) staining (I) and non‐alcoholic fatty liver disease (NAFLD) activity score analysis (J) (scale bars = 100 μm). (K and L) Frozen liver tissues were stained with Oil red O to assess lipid accumulation. Representative images are shown in panel K (scale bars = 100 μm). Quantification is shown in panel (L). In panel C–L, n = 6 per group; data are shown in mean ± SEM. *p < .05; **p < .01; ***p < .001
