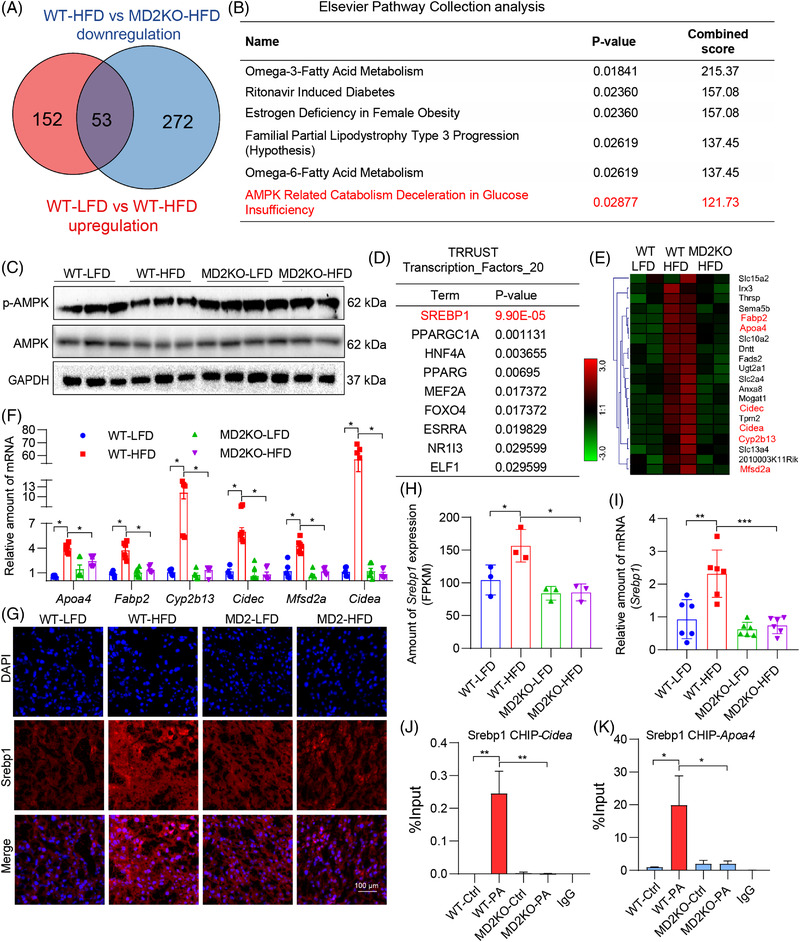
FIGURE 5.

Identification of AMPK/sterol regulatory element binding protein 1 (SREBP1) downstream of MD2 in lipid accumulation. (A) Venn diagram of genes up‐regulated in wildtype mice fed a high‐fat diet (WT‐HFD) compared to WT fed a control diet (WT‐low‐fat rodent diet [LFD]) (red), and genes down‐regulated in MD2KO mice fed an HFD compared to WT fed HFD (blue). (B) Elsevier pathway collection analysis of genes showing increased levels in WT‐HFD but restored in MD2KO mice fed an HFD. (C) Levels of AMPK and phosphorylated (p‐) AMPK in mouse liver tissue lysates. GAPDH was used as loading control. (D) Transcription factor motifs enriched in the subset of HFD‐induced genes whose expression is restored in MD2KO mice (53 genes) using TRRUST transcription_factors. (E) Heat map showing relative expression of SREBP1 target genes from panel A. (F) Select SREBP1 target genes were assessed by real‐time qPCR. Levels were normalized to Actb (n = 6; mean ± SEM; *p < .05). (G) Representative immunofluorescence staining of liver tissues for SREBP1 (red). Tissues were counterstained with DAPI (blue) (scale bar = 100 μm). (H) Levels of Srebp1 in liver tissues as detected by RNA‐sequencing from panel A (n = 3; mean ± SEM; *p < .05). (J) Levels of Srebp1 in liver tissues as detected by real‐time qPCR. Data normalized to Actb (n = 6; mean ± SEM; **p < .01 and ***p < .001). (J and K) Chromatin IP‐qPCR analysis of SREBP1 target gene promoters showing Cidea (J) and Apoa4 (K). Primary hepatocytes from WT and MD2KO mice were isolated and exposed to 200 μM palmitate (PA). IgG was used as negative control IP (n = 3; mean ± SEM; *p < .05 and **p < .01)
