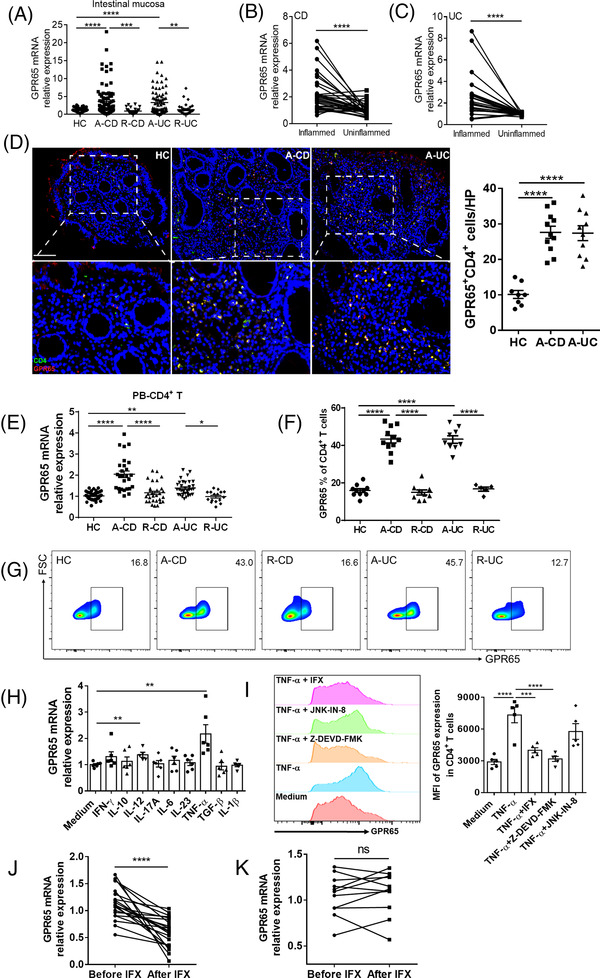
FIGURE 1.

GPR65 is upregulated in active IBD patients and robustly induced in CD4+ T cells by TNF‐α. (A) Relative expression of GPR65 mRNA analysed with qRT‐PCR in 87 patients with active CD (A‐CD), 31 CD patients in remission (R‐CD), 77 patients with active UC (A‐UC), 35 UC patients in remission (R‐UC), and 64 healthy controls (HC). (B) Expression of GPR65 mRNA in paired inflamed and uninflamed intestinal tissues of 33 A‐CD patients. (C) Expression of GPR65 mRNA in paired inflamed and uninflamed colon tissues of 25 A‐UC patients. (D) Co‐localisation of GPR65 and CD4+ T cells in the colon tissues from 8 HC, 11 A‐CD and 10 A‐UC, respectively, by immunofluorescence staining. Scale bars 100 μm. (E) Expression of GPR65 mRNA in PB‐CD4+ T cells from 27 A‐CD, 29 R‐CD, 33 A‐UC, 16 R‐UC and 38 HC. (F and G) GPR65 expression in PB‐CD4+ T cells of 10 HC, 12 A‐CD, 9 R‐CD, 9 A‐UC, and 5 R‐UC was analysed by flow cytometry, and the percentages of GPR65+ cell proportions in CD4+ T cells were shown in the bar chart. (H) PB‐CD4+ T cells (5×10⁵/ml) from 6 HC were stimulated with anti‐CD3 mAb (5 μg/ml) and anti‐CD28 mAb (2 μg/ml) in the presence of the indicated cytokines (20 ng/ml) for 72 h, and GPR65 expression was analysed by qRT‐PCR. (I) PB‐CD4+ T cells from 5 healthy controls were stimulated in vivo with immobilised anti‐CD3 mAb (5 μg/ml) and soluble anti‐CD28 mAb (2 μg/ml) in the presence of TNF‐α (20 ng/ml) together with anti‐TNF‐α mAb (i.e., infliximab, IFX, 50 ng/ml), JNK inhibitor (JNK‐IN‐8, 1 μM), and caspase‐3/8 inhibitor (Z‐DEVD‐FMK, 50 μM), respectively, for 72 h. GPR65 expression was analysed by flow cytometry, and MFI of GPR65 expression were shown in the bar chart. (J and K) 32 patients with active CD were receiving anti‐TNF mAb (i.e., IFX) treatment at weeks 0, 2 and 6, and intestinal mucosal biopsies were collected from these patients at week 14 after an induction therapy. Twenty‐one patients achieved clinical remission (J), and 11 patients failed to IFX therapy (K). Expression of GPR65 mRNA in intestinal mucosal biopsies was analysed by qRT‐PCR. Data were expressed as mean ± SEM. Statistical analysis was performed using ordinary one‐way analysis of variance (ANOVA) followed by Tukey's multiple comparison test (A, E, F, H and I), and unpaired Student's t test (B, C, J and K). *p < 0.05, **p < 0.01, ***p < 0.001, ****p < 0.0001
