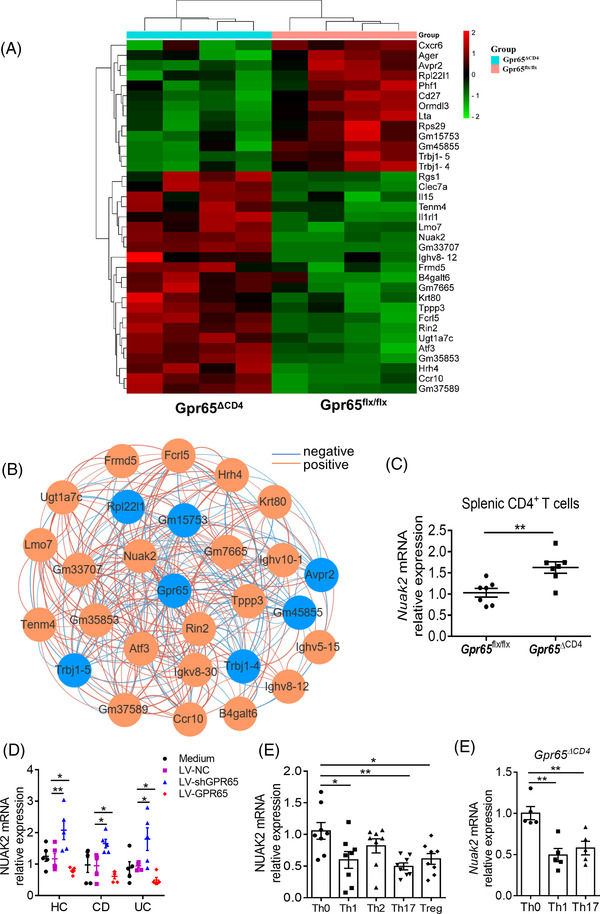
FIGURE 6.

GPR65 deficiency promotes NUAK2 expression in CD4+ T cells. Naïve splenic CD4+ T cells (n = 5/group) were harvested from Gpr65flx/flx and Gpr65ΔCD4 mice for RNA‐seq analysis. (A) Heatmap shows the differentially expressed genes between Gpr65flx/flx and Gpr65ΔCD4CD4+ T cells. (B) Differentially expressed genes with a Spearman correlation coefficient greater than 0.8 with Gpr65 in RNA‐seq data. The blue colour indicates a decrease of gene expression, and the orange colour indicates an increase of gene expression in Gpr65ΔCD4CD4+ T cells. (C) Expression of Nuak2 mRNA was detected in Gpr65flx/flx and Gpr65ΔCD4CD4+ T cells (n = 7/group) by qRT‐PCR. (D) Expression of Nuak2 mRNA was determined in LV‐shGPR65 and LV‐GPR65 transfected PB‐CD4+ T cells from HC, A‐CD, and A‐UC (n = 5/group), respectively. (E) PB‐CD4+ T cells were isolated from 8 healthy individuals and cultured under Th0‐, Th1‐, Th2‐, Th17‐ and Treg‐polarising conditions, respectively, for 5 days, and expression of Nuak2 mRNA was assessed by qRT‐PCR. (F) Naïve splenic CD4+ T cells were isolated from Gpr65ΔCD4 mice and cultured under Th0‐, Th1‐ and Th17‐ polarising conditions, respectively, for 5 days, and expression of Nuak2 mRNA was assessed by qRT‐PCR. Data were expressed as mean ± SEM. Statistical analysis was performed using Spearman correlation (B), unpaired Student's t test (C), two‐way analysis of variance (ANOVA) followed by Tukey's multiple comparison test (D), and ordinary one‐way ANOVA (E, F). *p < 0.05, **p < 0.01
