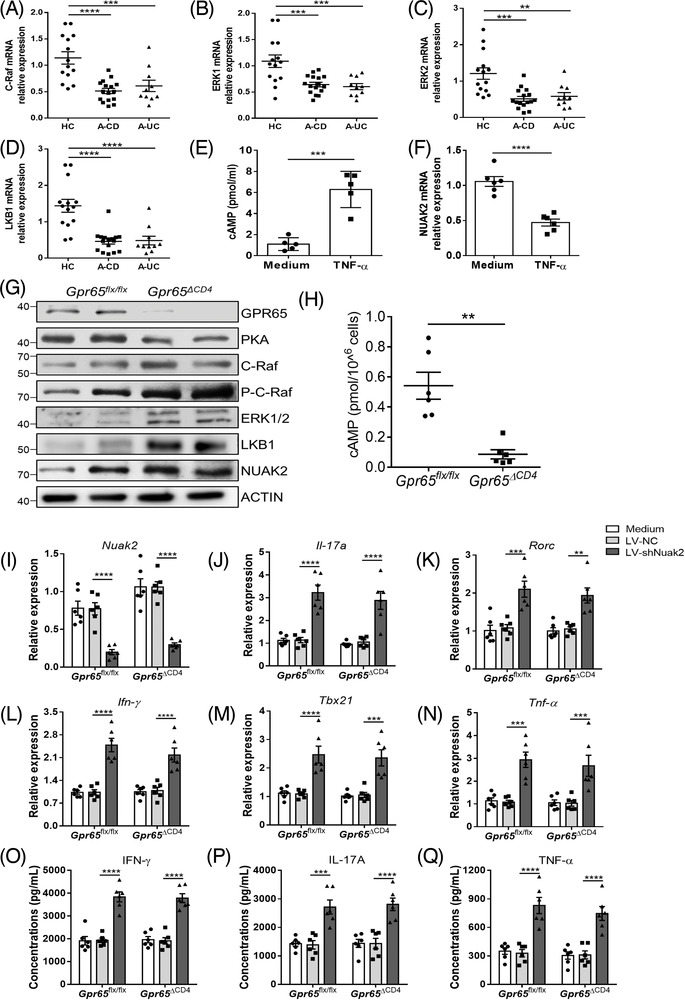
FIGURE 8.

GPR65 deficiency suppresses Th1 and Th17 cell immune response via activating the C‐Raf‐EKR1/2‐LKB1‐NUAK2 pathway in CD4+ T cells. (A to D) The expression of CRAF, ERK1/2, and LKB1 in PB‐CD4+ T cells from 14 HC, 16 A‐CD, and 10 A‐UC was detected by qRT‐PCR. (E and F) PB‐CD4+ T cells from five healthy controls were stimulated in vivo with immobilised anti‐CD3 mAb (5 μg/ml) and soluble anti‐CD28 mAb (2 μg/ml) in the presence of TNF‐α (20 ng/ml) for 72 h. cAMP level was analysed by ELISA, and NUAK2 expression was determined by qRT‐PCR. (G) Representative protein levels of GPR65, PKA, C‐Raf, P‐C‐Raf, ERK1/2, LKB1, and NUAK2 were detected in Gpr65flx/flx and Gpr65ΔCD4 splenic CD4+ T cells by Western blotting. (H) Production of cAMP in splenic CD4+ T cells of Gpr65flx/flx and Gpr65ΔCD4 mice was assessed by ELISA (n = 6/group). (I to Q) Splenic CD4+ T cells of Gpr65flx/flx and Gpr65ΔCD4 mice (n = 6/group) were transfected with lentivirus expressing Nuak2 shRNA and negative control (LV–NC), respectively, and then cultured with immobilised anti‐CD3 mAb (5 μg/ml) and soluble anti‐CD28 mAb (2 μg/ml) for 5 days. (I) The transduction efficiency of LV‐shNuak2 was confirmed by qRT‐PCR. (J to N) The mRNA levels of Il‐17a, Rorc, Ifn‐γ, Tbx21, and Tnf‐α were determined by qRT‐PCR in these transfected CD4+ T cells. (O to Q) The culture supernatants of these transfected CD4+ T cells were also harvested to determine the protein levels of IL‐17A, IFN‐γ, and TNF‐α, respectively, by ELISA. Data were expressed as mean ± SEM. Statistical analysis was performed using one‐way ANOVA (A to D), unpaired Student's t test (E, F and H), two‐way ANOVA followed by Tukey's multiple comparison test (I to Q). *p < 0.05, **p < 0.01, ***p < 0.001, ****p < 0.0001
