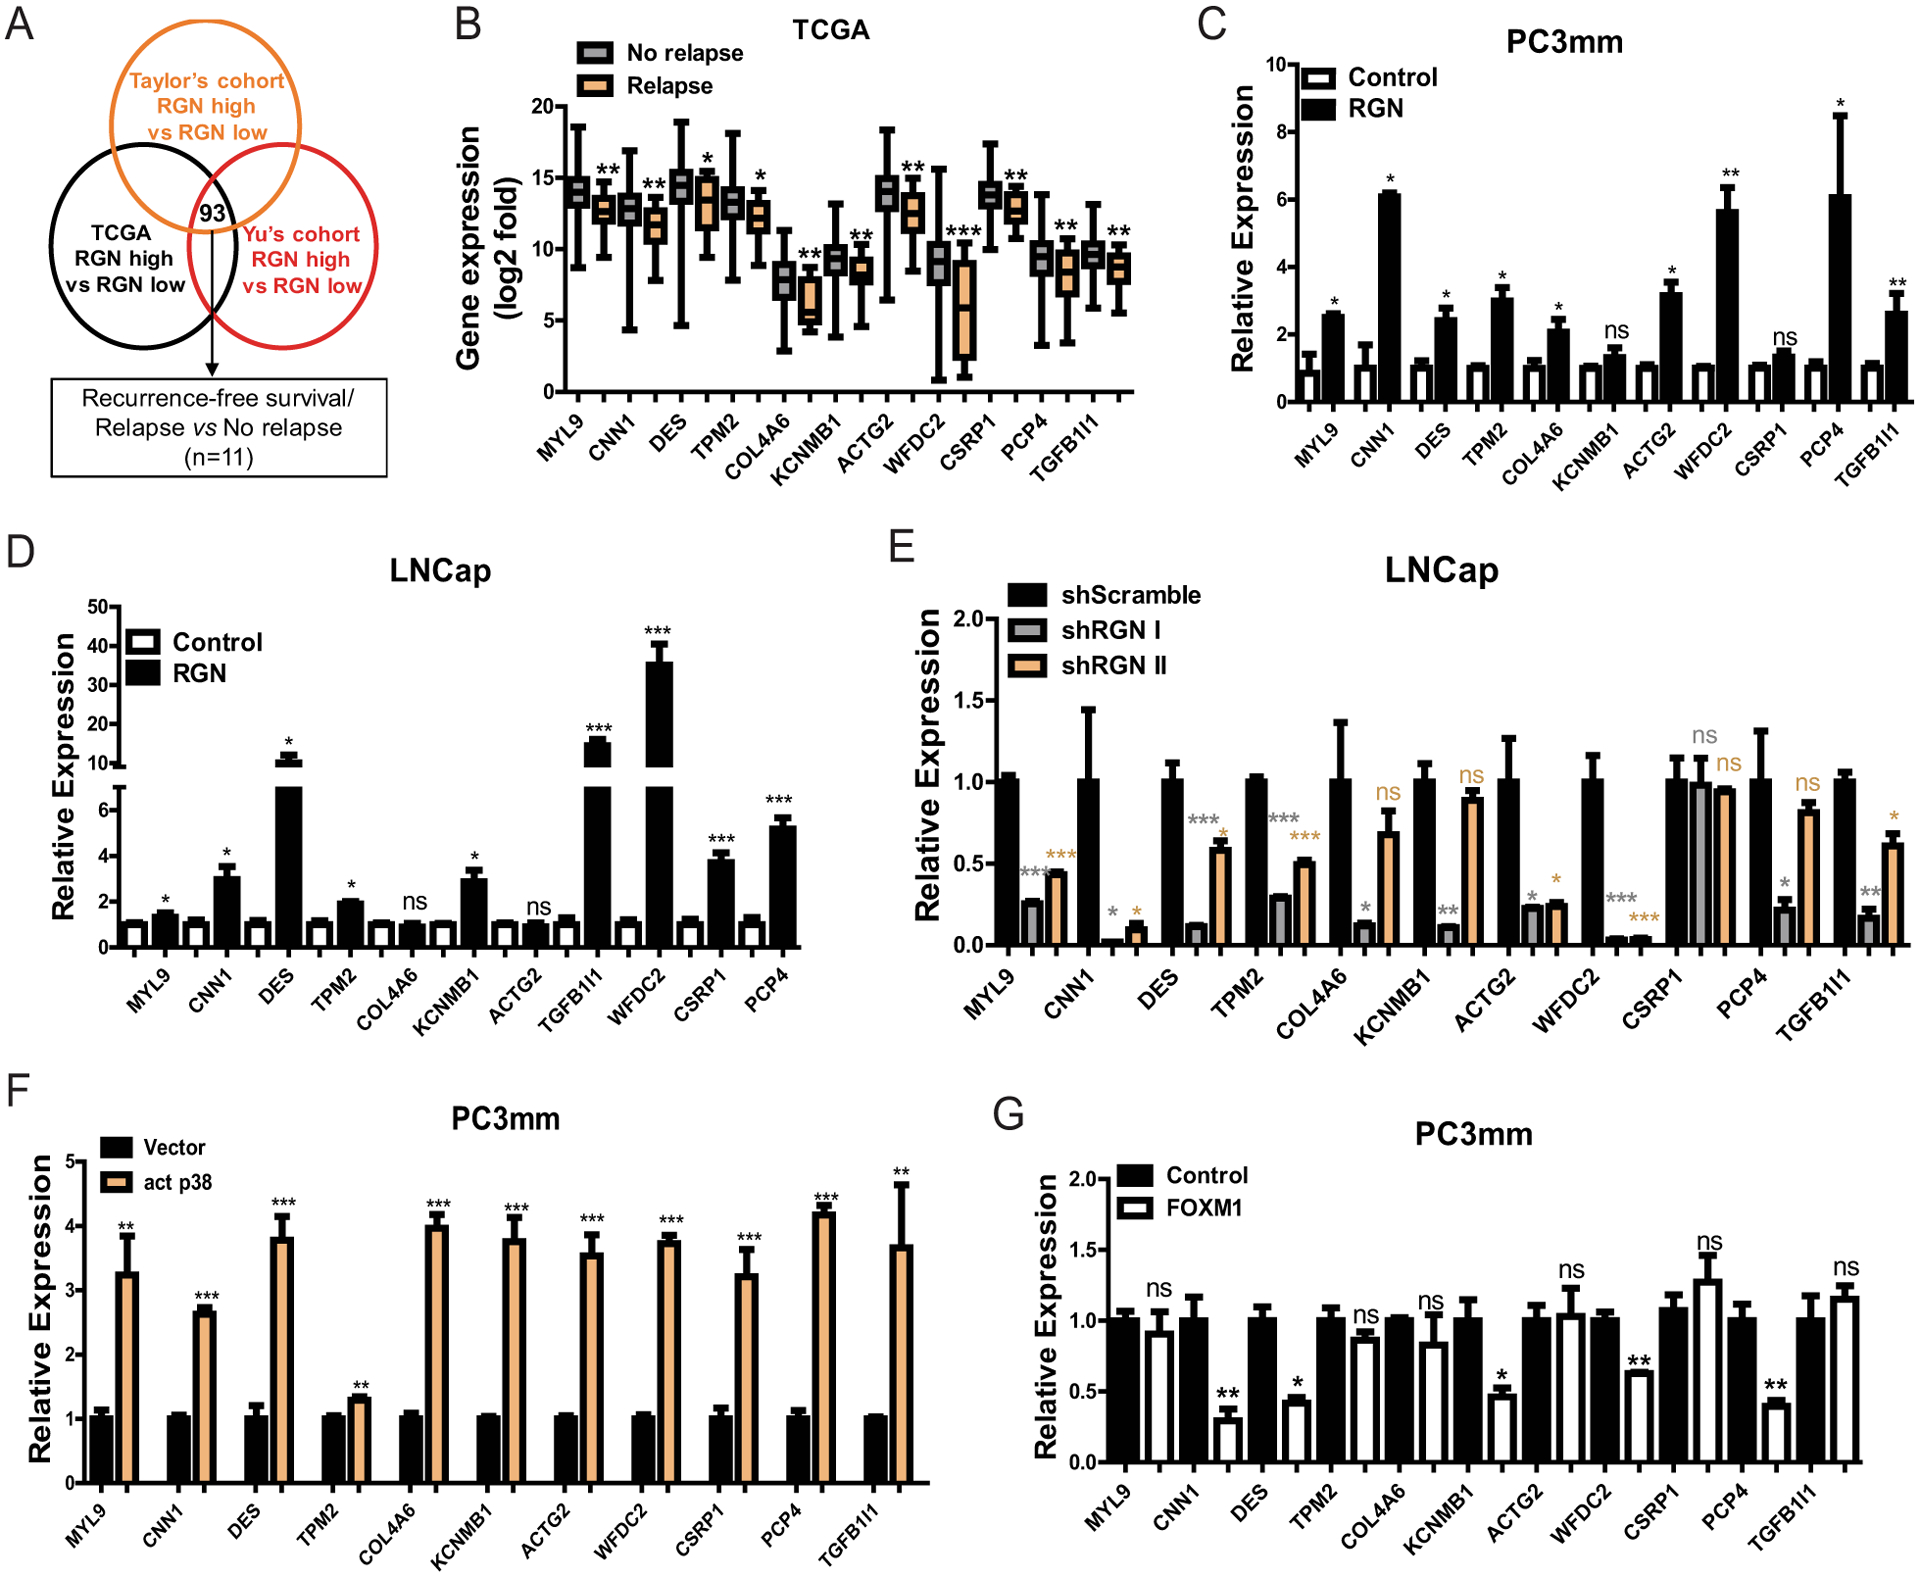
Figure 5: RGN expression enhances expression of cytoskeletal genes via p38 and FOXM1 signaling.

(A) Scheme outlining the approach to identify differentially expressed genes between lower- and upper-quartile RGN- expressing patients. 93 genes were found to be commonly upregulated in all 3 datasets (n=125/group for TCGA, n=23/group for GSE6919 and n=35/group for GSE21034). These genes were then screened by the TCGA dataset for their prognostic significance of recurrence-free survival and differential expression between patients with or without incidence of new tumor onset, (disease relapse vs no-relapse). 11 genes were selected based on these criteria. (B) Expression of 11 genes identified by screening shown in (A) was examined between No-relapse and Relapse groups. Unpaired t-test was used for Statistical analysis of each gene. (C–D) RGN was ectopically expressed in PC3mm (C) and LNCap (D) cells in a doxycycline dependent manner and the expression of 11 genes were examined by qRT-PCR. Unpaired t-test was used for statistical analysis of each gene. (E) RGN expression was suppressed in LNCap cells by infecting with two different shRNAs (#1 and #2), followed by performing qRT-PCR for indicated gene expression. One-way anova and tukey’s multiple comparison test was used for statistical analysis of each gene. (F) PC3mm cells were transfected with either vector only or activated p38 expressing vector followed by examining the levels of indicated gene by qRT-PCR. Unpaired t-test was used for statistical analysis of each gene. (G) Expression levels of indicated genes were examined in PC3mm cells expressing vector control or FOXM1. Unpaired t-test was used for statistical analysis of each gene. *, P-value<0.05, ** P-value<0.01 and ***, P-value<0.0001.
