Figure 2.

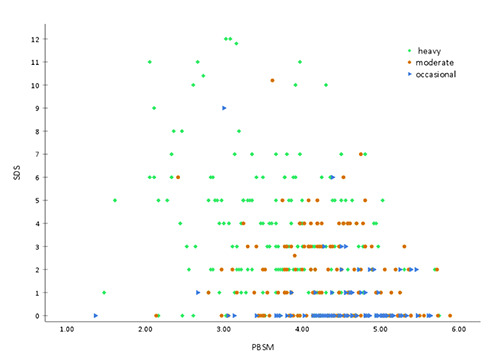
Scatterplot of SDS and PBSM values grouped by use frequency. The scatterplot shows the relationship between PBSM and SDS for heavy (green, 5-7x/week), moderate (orange, 1-4x/week), and occasional (blue, 1x/month) users of cannabis.

Scatterplot of SDS and PBSM values grouped by use frequency. The scatterplot shows the relationship between PBSM and SDS for heavy (green, 5-7x/week), moderate (orange, 1-4x/week), and occasional (blue, 1x/month) users of cannabis.