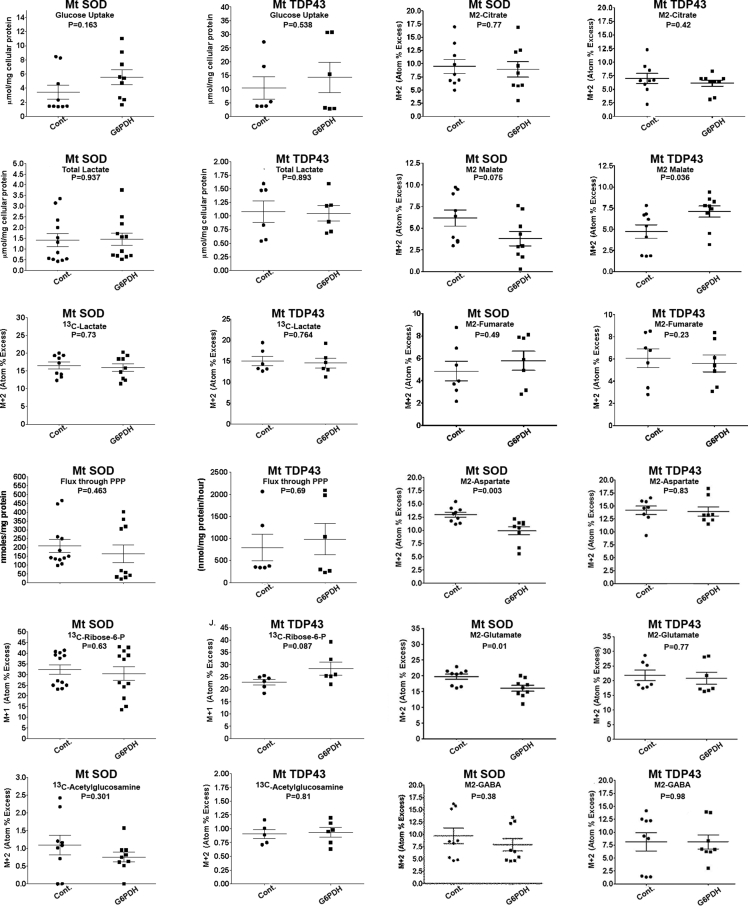
Supplemental Figure 9.
Metabolic interrogation of glycolysis, the TCA cycle and related pathways in neurons expressing fALS genes with or without knockdown of G6PDH. Scattergrams of data from neurons expressing Mt SOD1 or Mt TDP43 with miRNA mediated knockdown of G6PDH or expression of a control miRNA (”Cont.”). P values from Student's t-test are presented in every panel. The only statistically significant differences were: 1) higher levels of M + 2-malate in Mt TDP43 expressing neurons with G6PDH knockdown versus control, 2) lower levels of M + 2-asparate in Mt SOD1 expressing neurons with G6PDH knockdown versus controls and 3) lower levels of M + 2-glutamate in Mt SOD1 expressing neurons with G6PDH knockdown versus controls (compare to Figure 2, Figure 3 in main text).

