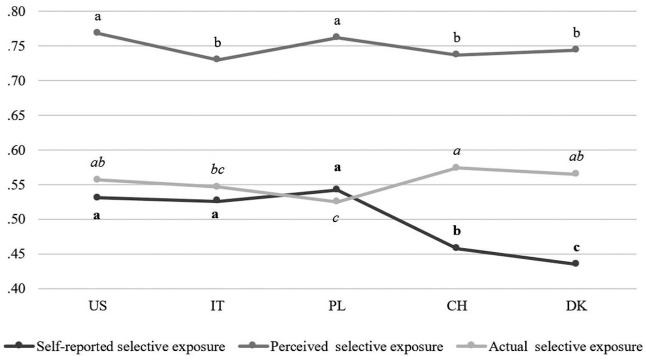
Figure 3.
Cross-country differences for three selective exposure measures (ANCOVA).
Predicted average levels of self-reported, perceived and actual selective exposure by country. All three selective exposure measures were rescaled on a 0–1 scale to make them comparable. (1) Self-reported SE: F(4, 3448) = 32.44, p < .001, η2 = .036. (2) Perceived SE: F(4, 3080) = 6.32, p < .001, η2 = .008. (3) Actual SE: F(4, 3465) = 3.43, p < .01, η2 = .004. Groups with different identification letters (a, b, c) are significantly different according to Bonferroni-corrected post hoc tests (p < .05).

