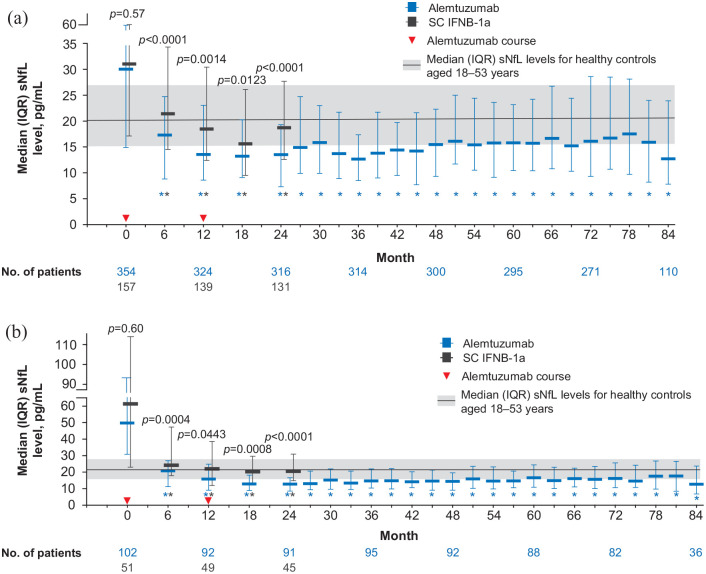
Figure 2.
sNfL levels over time in patients treated with alemtuzumab or SC IFNB-1a in (a) the overall CARE-MS I population and (b) the CARE-MS I HAD subgroup.
ANCOVA: analysis of covariance; HAD: highly active disease; IQR: interquartile range; SC IFNB-1a: subcutaneous interferon beta-1a; sNfL: serum neurofilament light chain.
Plot shows unadjusted sNfL values. p-Values indicate comparison between treatment groups (baseline: Wilcoxon rank sum test; post-baseline: rank ANCOVA adjusted for age and baseline sNfL).
*p < 0.0001 for comparison of baseline with each post-baseline time point (Wilcoxon signed rank test). sNfL values below the lower limit of quantification were imputed; this represented 86/7100 (1.2%) alemtuzumab samples and 5/721 (0.7%) SC IFNB-1a samples. Solid line and shaded area represent median and IQR (20.6 pg/mL (15.6−27.1) sNfL level for healthy controls aged 18–53 years (the age range of CARE-MS I patients).

