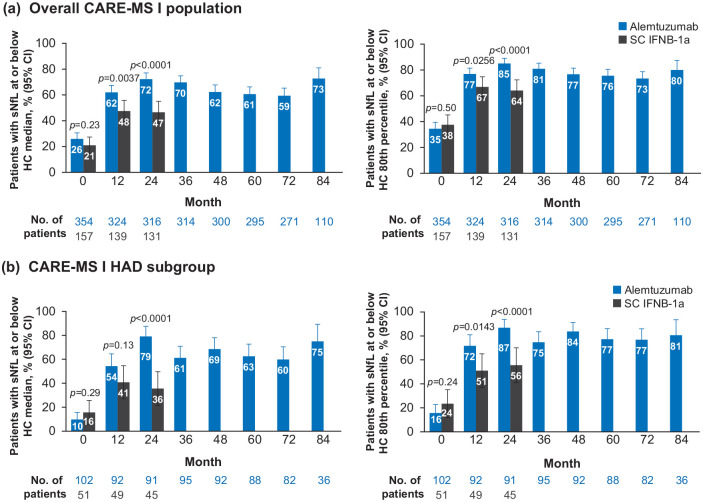
Figure 3.
Proportions of patients with sNfL level at or below the median level for age-matched healthy controls (left panels) and at or below the 80th percentile of age-matched healthy controls (right panels) for (a) the overall CARE-MS I population and (b) the CARE-MS I HAD subgroup.
CI: confidence interval; HAD: highly active disease; HC: healthy controls; SC IFNB-1a: subcutaneous interferon beta-1a; sNfL: serum neurofilament light chain.
p-Values indicate comparison between treatment groups and are based on chi-square test.

