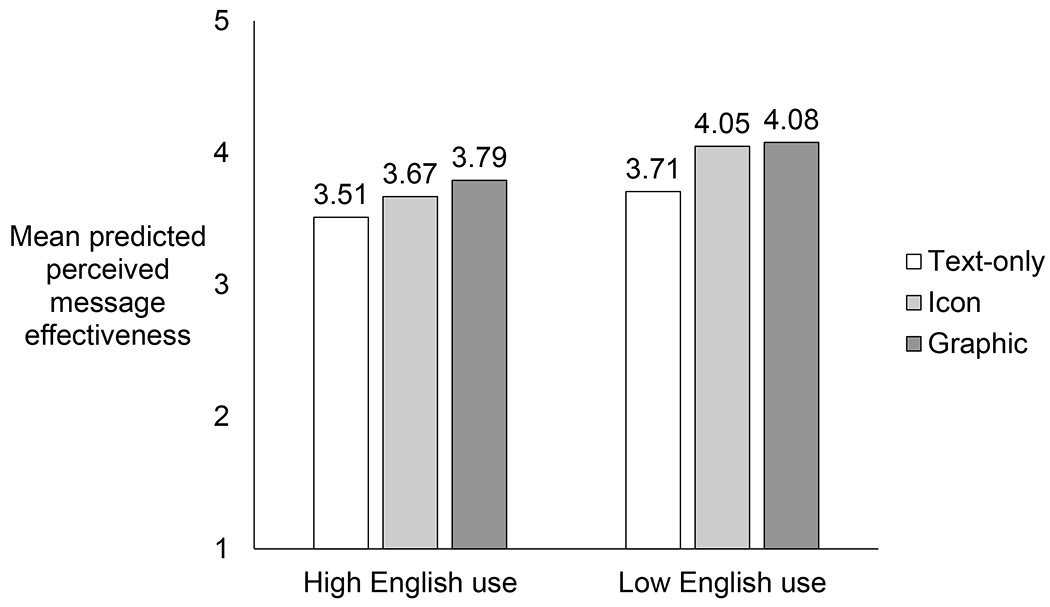
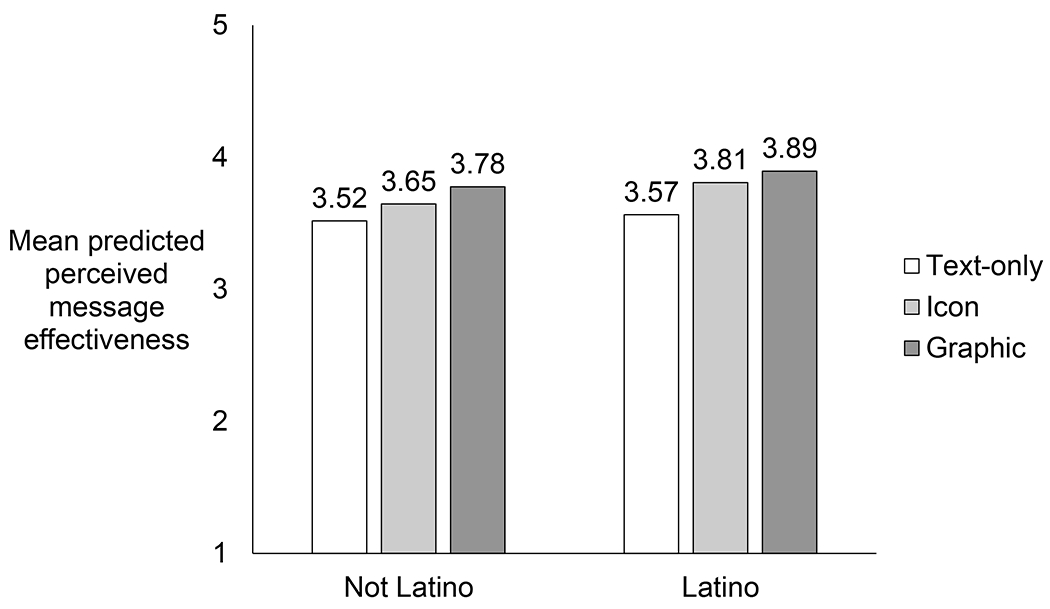
Figure 2.


Effects of graphic and icon warnings relative to text-only by English language use (Panel A), p=.024 for moderation of icon vs. text-only warnings, p=.233 for moderation of graphic vs. text-only warnings; and by Latino ethnicity (Panel B), p=.034 for moderation of icon vs. text-only warnings, p=.19 for moderation of graphic vs. text-only warnings.
