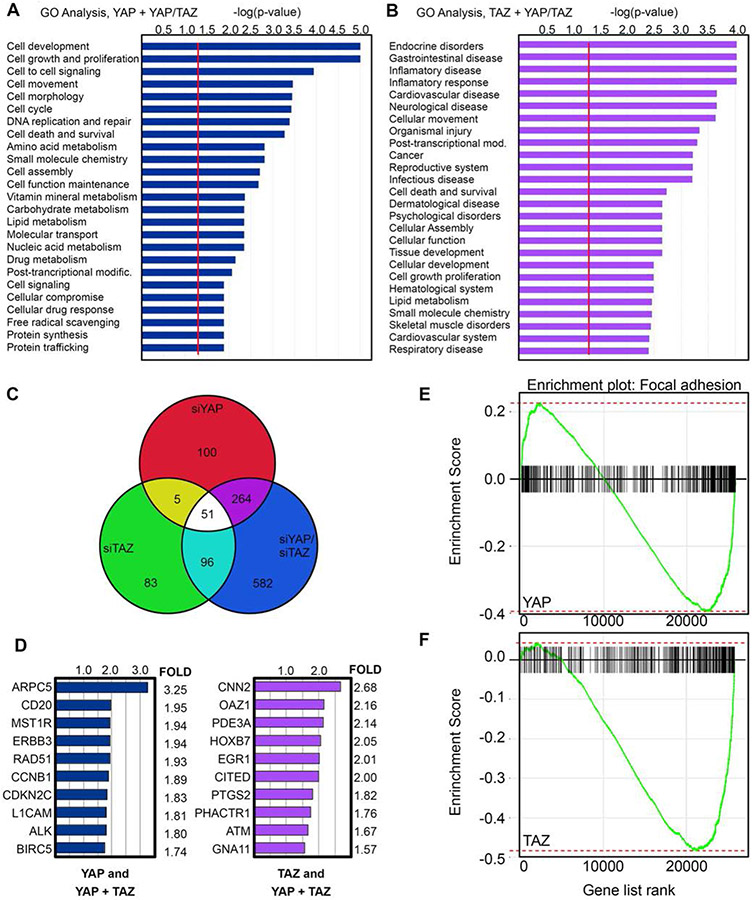
Figure 3.
YAP and TAZ have both overlapping and unique transcriptomes. (A,B) Gene Ontology (GO) analysis of differentially expressed genes in YAP and YAP/TAZ (A), and to TAZ and YAP/TAZ (B) depleted RNA-seq analysis in mel537 melanoma cells. Data represented as -log(p-value), where significance is determined as being above the threshold as indicated by the red line. For the RNA-seq analysis, the false discovery rate was set at p<0.05 and a fold change of > 1.5 as compared to siScrambled control. (C) Venn Diagram schematic representing the total numbers of differentially expressed genes of the three groups: YAP knockdown, TAZ knockdown, YAP/TAZ knockdown. (D) Representative list of differentially expressed genes from the RNA-Sequencing. Data represented as the mean of the fold changes from the biological duplicates. (E-F) Gene Set Enrichment Analysis (GSEA) of siYAP (E) and siTAZ (F) RNA-sequencing samples (GO:0005925). Statistics for GSEA for siYAP (E) padj = 0.004, NES = −1.657, ES = −0.395, and siTAZ (F) padj = 0.008, NES = −2.35, ES = −0.484 (both sets p<0.05).

