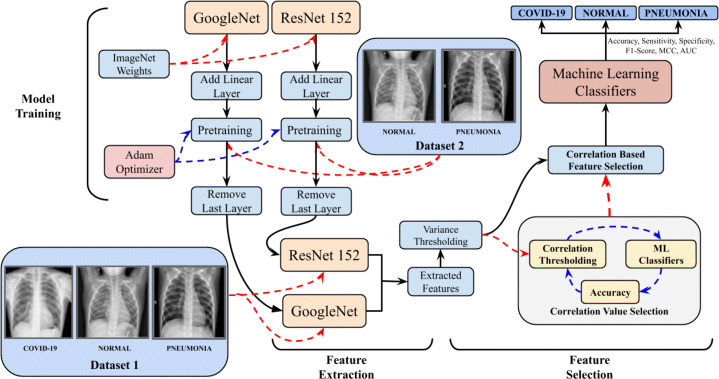
Fig. 3.
Illustration of the flow of information and data in the proposed framework for the accurate prediction of the COVID-19 v/s Pneumonia v/s Normal patients. Bold black arrows (→) represent the flow of data in the network. Red dashed arrow () represent the input entity to the module being pointed to with blue dashed arrow () representing the iterations on the module on the left side of the dashed arrow by the module on the right side of the dashed arrow

