
Figure 2:
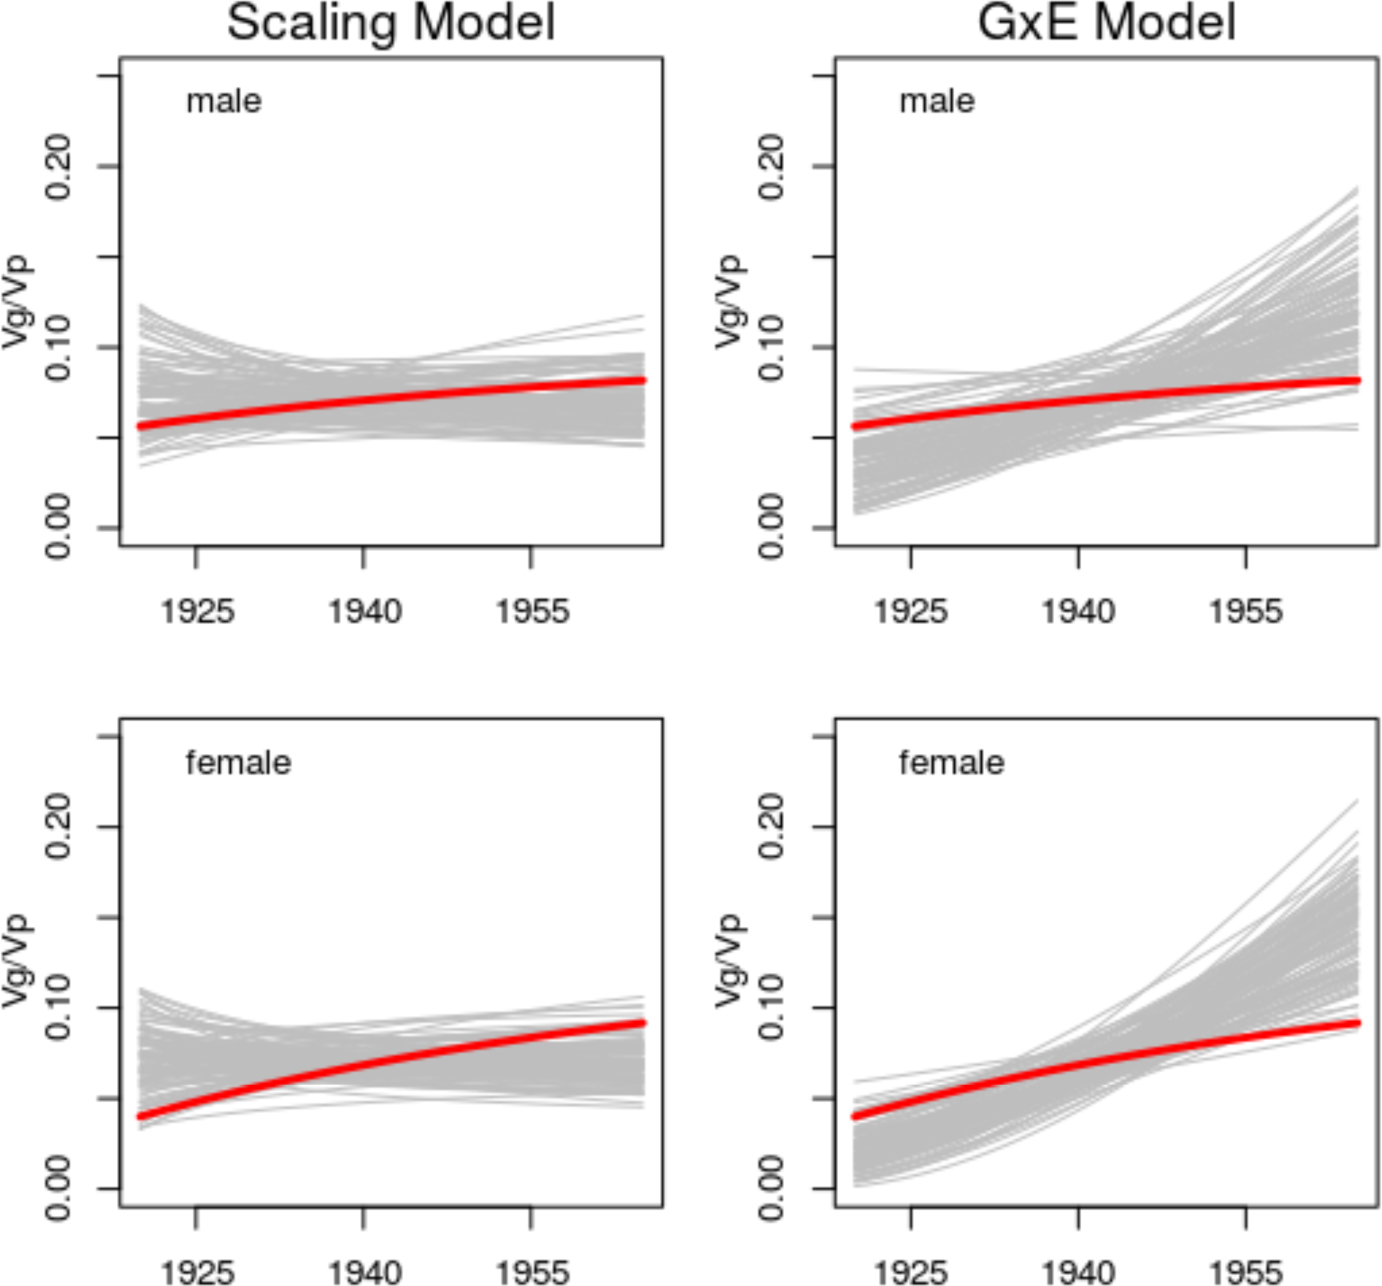
Gray lines represent genetic penetrance as a function of birth year simulated based on either the scaling model (Eqn 13, on left) or the standard homoscedastic GxE model (Eqn 1, on right). Red lines represent genetic penetrance as a function of birth year estimated from the real data using the heteroscedastic regression model (Eqn 2). Analyses based on standardized BMI data.