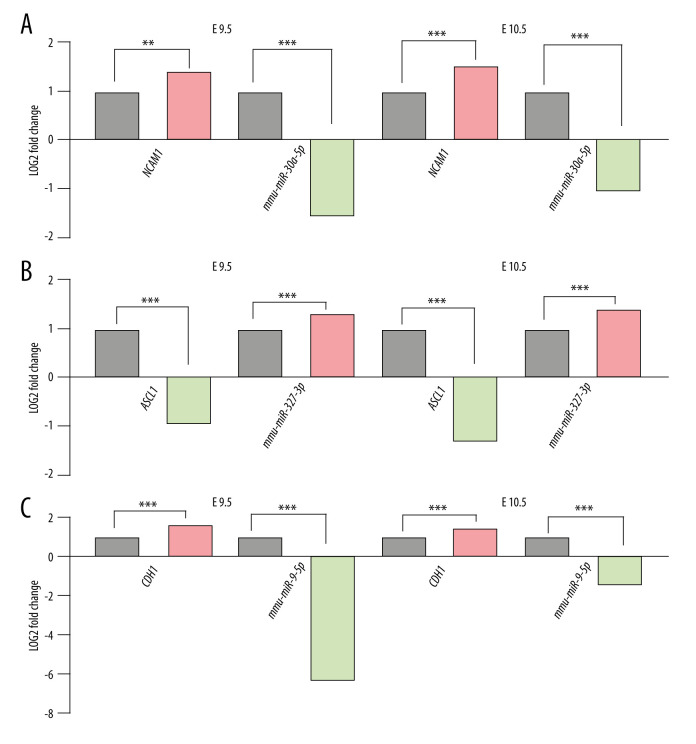
Figure 4.
Differential expression of miRNA-mRNA pairs in E9.5 and E10.5. (A) mmu-miR-30a-5p-Ncam1; (B) mmu-miR-375-3p-Ascl1; (C) mmu-miR-9-5p-Cdh1; Gray: Control; Red: Upregulated in NTDs; Green: Downregulated in NTDs. n=3,* P<0.05, ** P<0.01, *** P<0.001. Data were analyzed and visualized using the software GraphPad Prism, version 8.0, supported by GraphPad Software.

