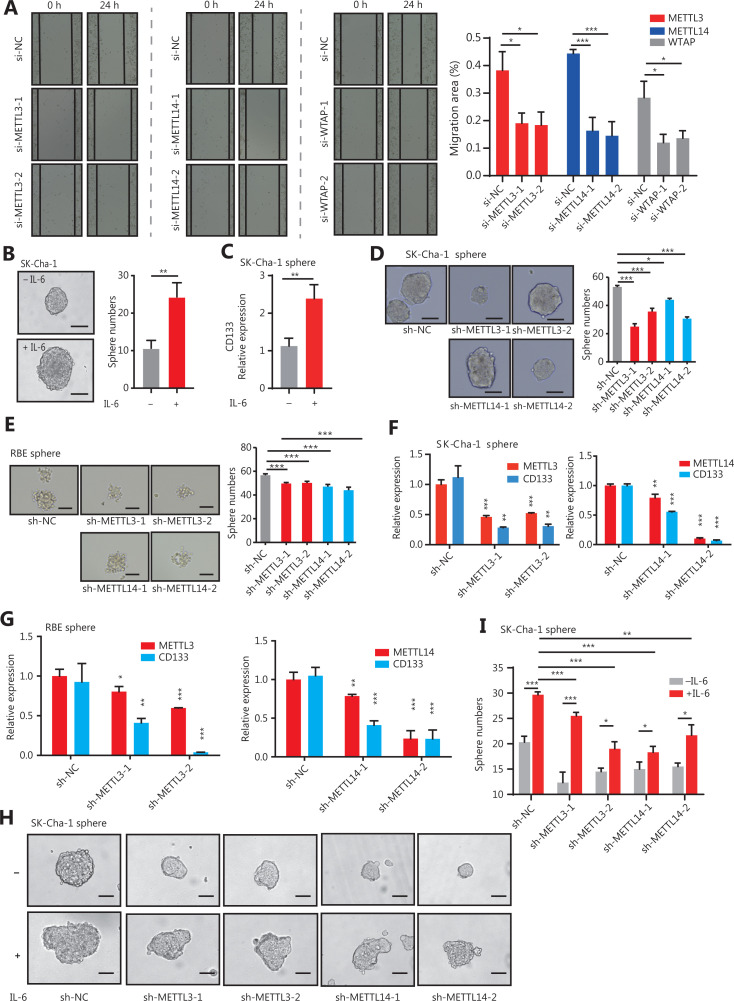
Figure 2.
The m6A writers maintained the stem-like properties of CCA cells in response to inflammation. (A) Using a wound healing assay, the cell motilities of METTL3, METTL14, and WTAP-silenced CCA SK-Cha-1 cells were observed at 0 and 24 h following wounding by a pipette tip. Original magnification: 100×. Quantitative analysis of the migration. Error bars denote ± SEM (*P < 0.05; ***P < 0.001) based on 3 independent experiments. (B) Morphology and number of mammospheres of CCA cells treated with or without 20 ng/mL IL-6 for 2 h. Scale bars: 50 μm. Error bars denote ± SEM (*P < 0.05; ***P < 0.001). (C) The qRT-PCR showing the expression levels of CD133 in SK-Cha-1 cell mammospheres in the IL-6 treatment vs. control groups. Error bars denote ± SEM (***P < 0.001) based on 3 independent experiments. (D, E) Morphology and numbers of mammospheres of SK-Cha-1 cells upon sh-METTL3 (D) and METTL14 (E) knockdown. Scale bars: 50 μm. Error bars denote ± SEM (*P < 0.05; **P < 0.01; ***P < 0.001) in 3 independent experiments. (F, G) The qRT-PCR showed the expression levels of METT3, METTL14, and CD133 significantly downregulated in the knockdown of METTL3 (F) and METTL14 (G) SK-Cha-1 cell mammospheres. (H) Measurement of the morphology and number of mammospheres after 20 ng/mL IL-6 treatment in sh-METTL3 or sh-METTL14 CCA cells for 2 h, respectively. Scale bars: 50 μm. Error bars denote ± SEM (*P < 0.05; ***P < 0.001) in 3 independent experiments. (I) The qRT-PCR showed the expression levels of CD133 after 20 ng/mL IL-6 treatment in the sh-METTL3 or sh-METTL14 CCA cells for 2 h. Error bars denote ± SEM (*P < 0.05; ***P < 0.001) in 3 independent experiments.

