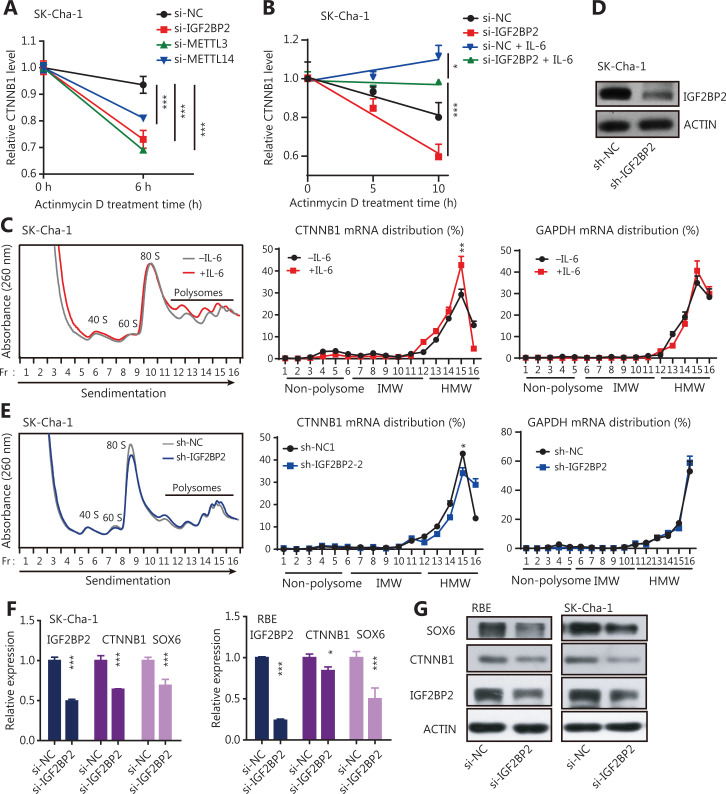
Figure 5.
The m6A writers maintained the expression of stemness-related genes in a m6A-IGF2BP2-dependent manner in inflammatory responses. (A) RNA stability of CTNNB1 transcripts detected by qRT-PCR in IGF2BP2, METT3, or METTL14 knockdown CCA cells. Actinomycin D (Act D) has been used in the assays. Error bars denote ± SEM (***P < 0.001) in 3 independent experiments. (B) The RNA stability of CTNNB1 transcripts was detected by qRT-PCR in IGF2BP2 knockdown SK-Cha-1 cells (with or without 20 ng/mL IL-6 treatment for 2 h). The transcription inhibitor, Act D has been used in the assays. Error bars denote ± SEM (*P < 0.05; ***P < 0.001) in 3 independent experiments. (C) Polysomes in extracts of SK-Cha-1 cells treated for 2 h with or without 20 ng/mL IL-6 was fractionated using sucrose gradients, and the relative levels of CTNNB1 mRNA were analyzed by qRT-PCR in the gradient fractions. Glyceraldehye 3-phosphate dehydrogenase (GAPDH) mRNA was used as the negative control. The enrichment of the CTNBB1 mRNA at the peak point in the HMW fraction was significantly increased after IL-6 treatment (**P < 0.01). (D) Immunoblots showing the expression levels of IGF2BP2 in sh-IGF2BP2-downregulated SK-Cha-1 cells. (E) Polysome profiling of CTNNB1 mRNA in sh-NC and sh-IGF2BP2 SK-Cha-1 cells. GAPDH mRNA acted as the negative control. The enrichment of the CTNBB1 mRNA at the peak point in the HMW fraction was significantly decreased after IGF2BP2 knockdown (*P < 0.05). (F) The qRT-PCR showing the expression levels of IGF2BP2, CTNNB1, and SOX6 in IGF2BP2-downregulated CCA cells. Error bars denote ± SEM (*P < 0.05; ***P < 0.001) in 3 independent experiments. (G) Immunoblots showing the expression levels of CTNNB1 and SOX6 in si-IGF2BP2 CCA cells.

