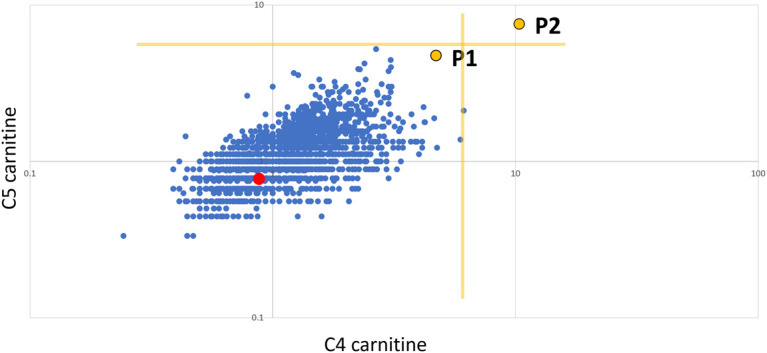
Figure 5.

Retrospective reanalysis of newborn blood spot screening (NBS). C5 carnitine vs C4 carnitine expressed as multiples of median (log:log scale). P1 is the proband, P2 is an unrelated neonate with a confirmed ETHE1 defect, the red dot is the unaffected sibling of P1, the blue dots represent control neonates (n = 3215), and the yellow lines indicate decision limits for a repeat sample (∼99.95%ile).
