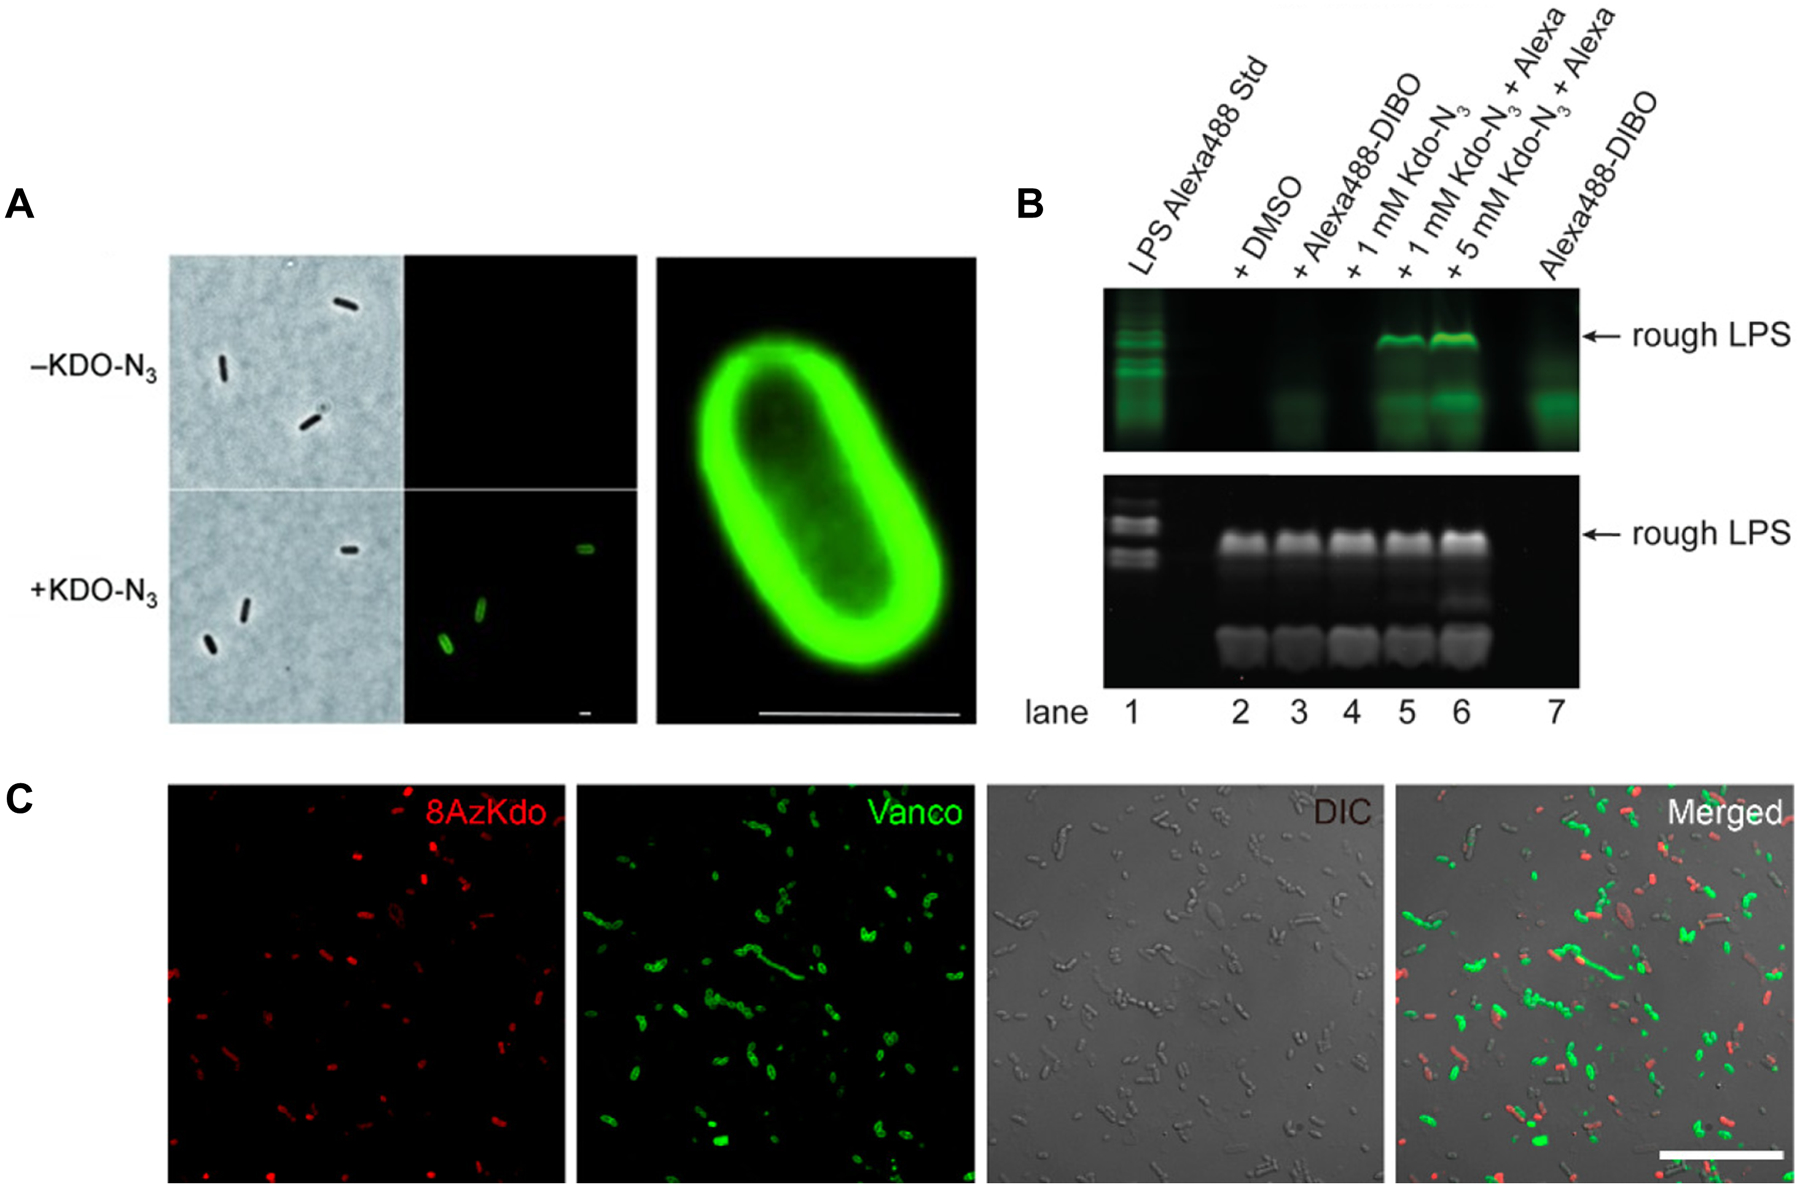
Figure 20.

Imaging the LPS core region using KDO reporters. (A) E. coli K12 was incubated in the presence of KDO-N3 (55), fixed, subjected to CuAAC with azido-488, and imaged by fluorescence microscopy. Right, expanded deconvoluted image of labeled E. coli cell. Scale bars, 1 μm. Reproduced with permission from ref 165. Copyright 2012 Wiley-VCH. (B) E. coli was incubated in the presence of KDO-N3 (55) and subjected to SPAAC with a cyclooctyne-488 reagent. LPS was extracted and separated by SDS-PAGE and visualized by fluorescence imaging (top) or by LPS staining with Pro-Q Emerald 300 LPS staining kit (bottom). Reproduced with permission from ref 166. Copyright 2017 American Society for Biochemistry and Molecular Biology. (C) Mouse gut microbiotas were labeled with KDO-N3 (55, shown in red text as 8AzKdo), subjected to CuAAC with alkyne-TAMRA, labeled with fluorophore-conjugated vancomycin (shown in green text as Vanco), and imaged by confocal fluorescence microscopy. Fluorescence, DIC, and merged images are shown. Scale bar, 20 μm. Reprinted with permission from ref 173. Copyright 2017 American Chemical Society.
