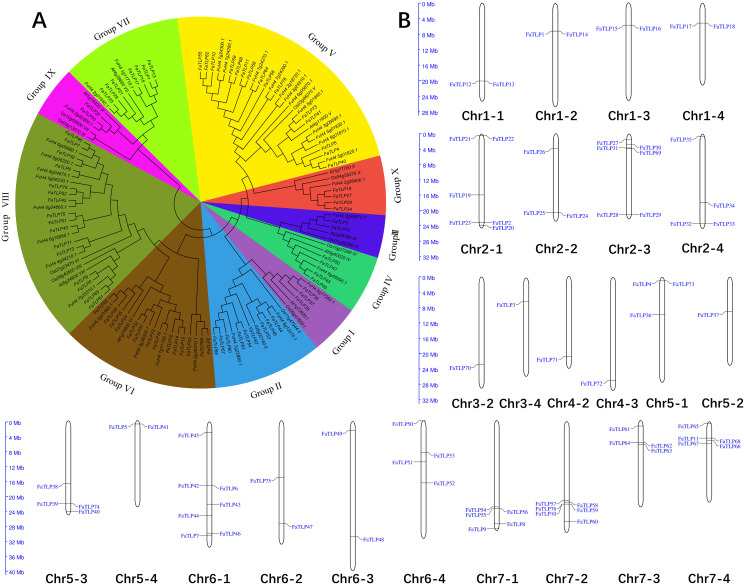
Figure 1. Phylogenetic analysis and chromosome distribution analyses of the TLP gene family.
(A) A phylogenetic tree was constructed for F. × ananassa, F. vesca, Arabidopsis thaliana, and Oryza sativa using MEGA 6.0 with bootstrap values of 1,000. All of the tested TLP genes were divided into 10 groups (Groups I to X), represented by different colors. (B) The distribution of FaTLP on 24 different chromosomes.

