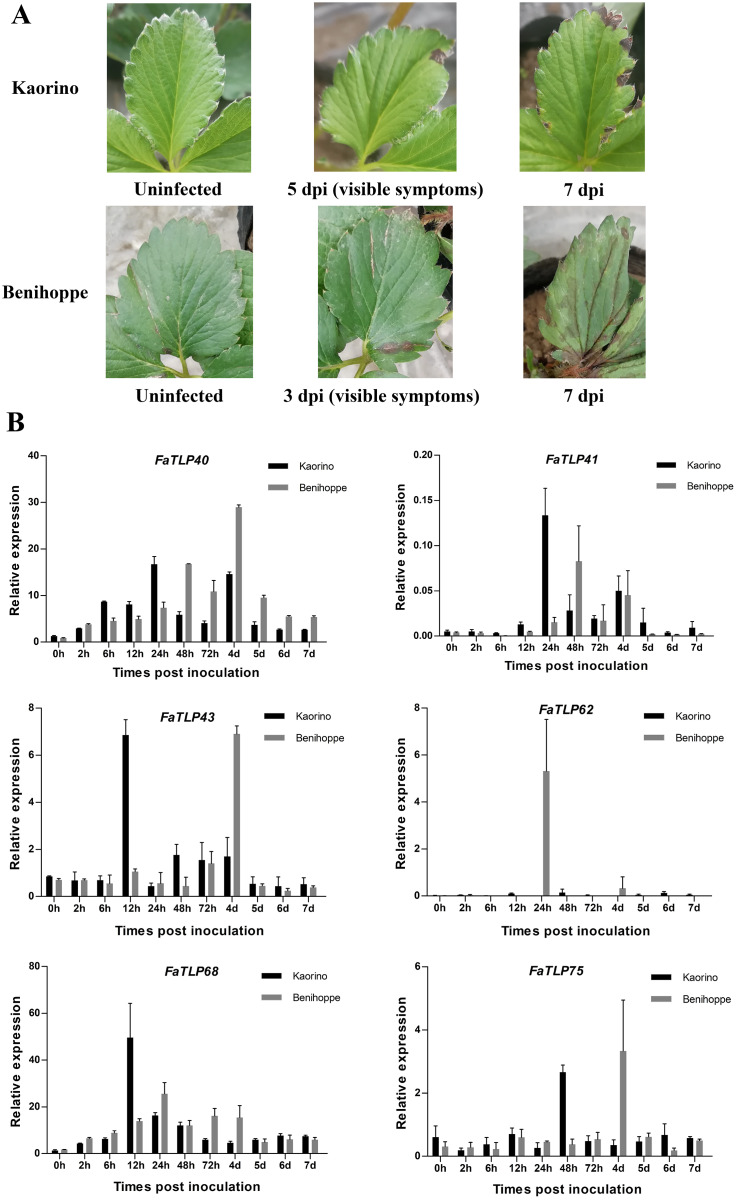
Figure 3. Time course of different resistant strawberry leaves and the qRT-PCR results of TLP gene responses to C. gloeosporioides infection.
(A) The progression of symptoms between ‘Kaorino’ and ‘Benihoppe’ after C. gloeosporioides inoculation. Visible symptoms appeared earlier and progressed faster in ‘Benihoppe’. (B) The expression analysis of FaTLP (FaTLP40, FaTLP41, FaTLP43, FaTLP62, FaTLP68, and FaTLP75) in different resistant strawberry cultivars after infection. The x-axis represents the different times post-inoculation. The y-axis represents relative expression. Black and gray sections represent ‘Kaorino’ and ‘Benihoppe’, respectively. The results were normalized against the reference gene and shown as means of three replicates ± SDs.

