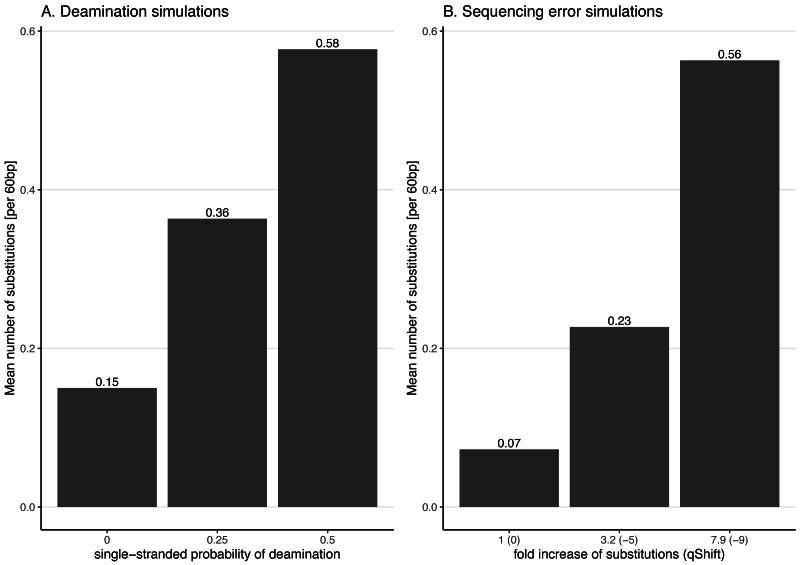
Figure 3. Average number of substitutions for the deamination and sequencing error simulations.
Observed average number of substitutions for different simulation parameter values for the deamination and sequencing error simulations. Shown here are the observed values for the case of NC_006273.2 (Human betaherpes virus 5) with 39,270 simulated reads of length 60 bp. For the deamination simulations, the single-stranded probability (see Fig. 2) of the deamSim gargamel subprogram (Renaud et al., 2017) is increased from 0 to 0.5. Note that deamination takes place with a probability of 0.01 across the read for all the deamination simulations so that there are additional errors even with a single stranded probability set at 0. For the sequencing error simulations, the parameter qShift of ART was decreased from 0 to −9 which corresponds to a 1 fold (qShift of 0) to 7.9 fold (qShift of −9) increase compared to standard Illumina HiSeq2500 sequencing (Huang et al., 2012).

