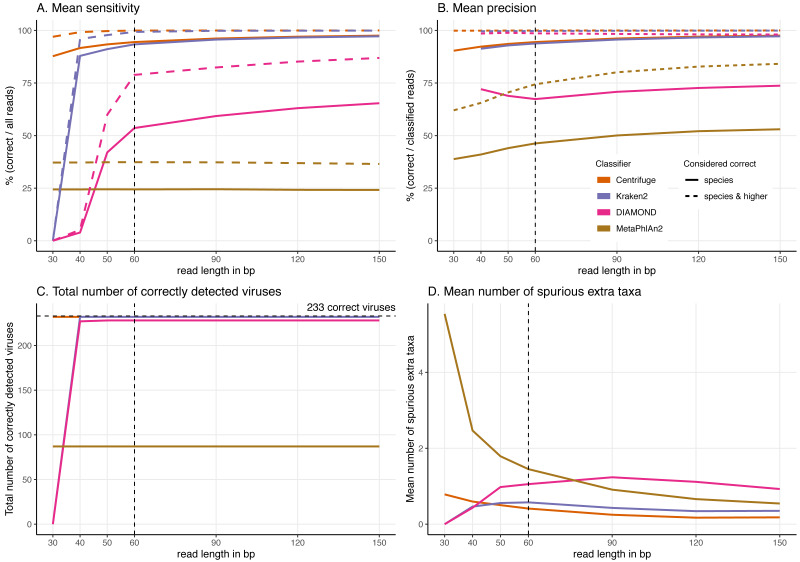
Figure 5. Effect of the read length on the classification performance.
For these simulations, read length was varied from 30 to 150 bp. (A) Average Sensitivity_s (continuous lines) and Sensitivity_s&h (dashed lines) for each classifier. (B) Average Precision_s (continuous lines) and Precision_s&h (dashed lines) for each classifier. (C) Total number of viruses detected out of the 233 tested. The dashed line shows the maximum number of detectable viruses. (D) Average number of spurious extra taxa across simulated viral sequences. The vertical dashed line indicates the initial 60 bp read set.

