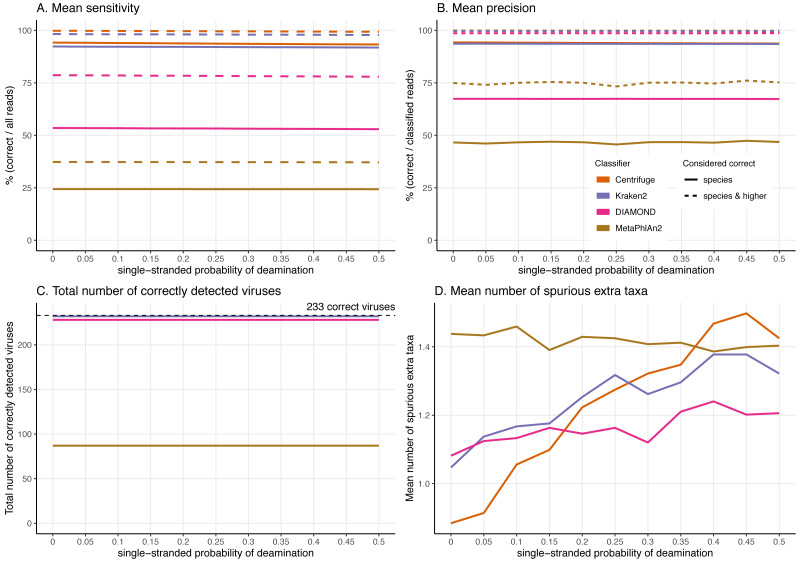
Figure 6. Effect of the deamination damage on the classification performance.
For these simulations, errors were added using deamSim gargamel subprogram which assumes an ancient DNA deamination-like distribution and were added in addition to the ART Illumina like sequencing errors. The results shown here correspond to a single-stranded probability of deamination varying from 0 to 0.5. For all the results the nick frequency is set at 0.03, the average length of overhanging ends is set at 0.25, and the probability of deamination in the double-stranded portions of DNA is set at 0.01. A) Average Sensitivity_s (continuous lines) and Sensitivity_s&h (dashed lines) for each classifier. (B) Average Precision_s (continuous lines) and Precision_s&h (dashed lines) for each classifier. (C) Total number of viruses detected out of the 233 tested. The dashed line shows the maximum number of detectable viruses. (D) Average number of spurious extra taxa across simulated viruses.

