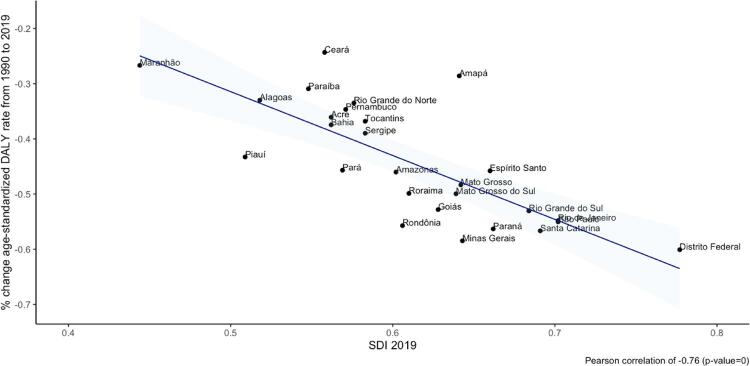
Chart 1-14. – Correlation between percent change of age-standardized DALY rates 2019/1990 and the 2019 sociodemographic index (SDI 2019).
Source: Data derived from Global Burden of Disease Study 2019, Institute for Health Metrics and Evaluation, University of Washington. 46

