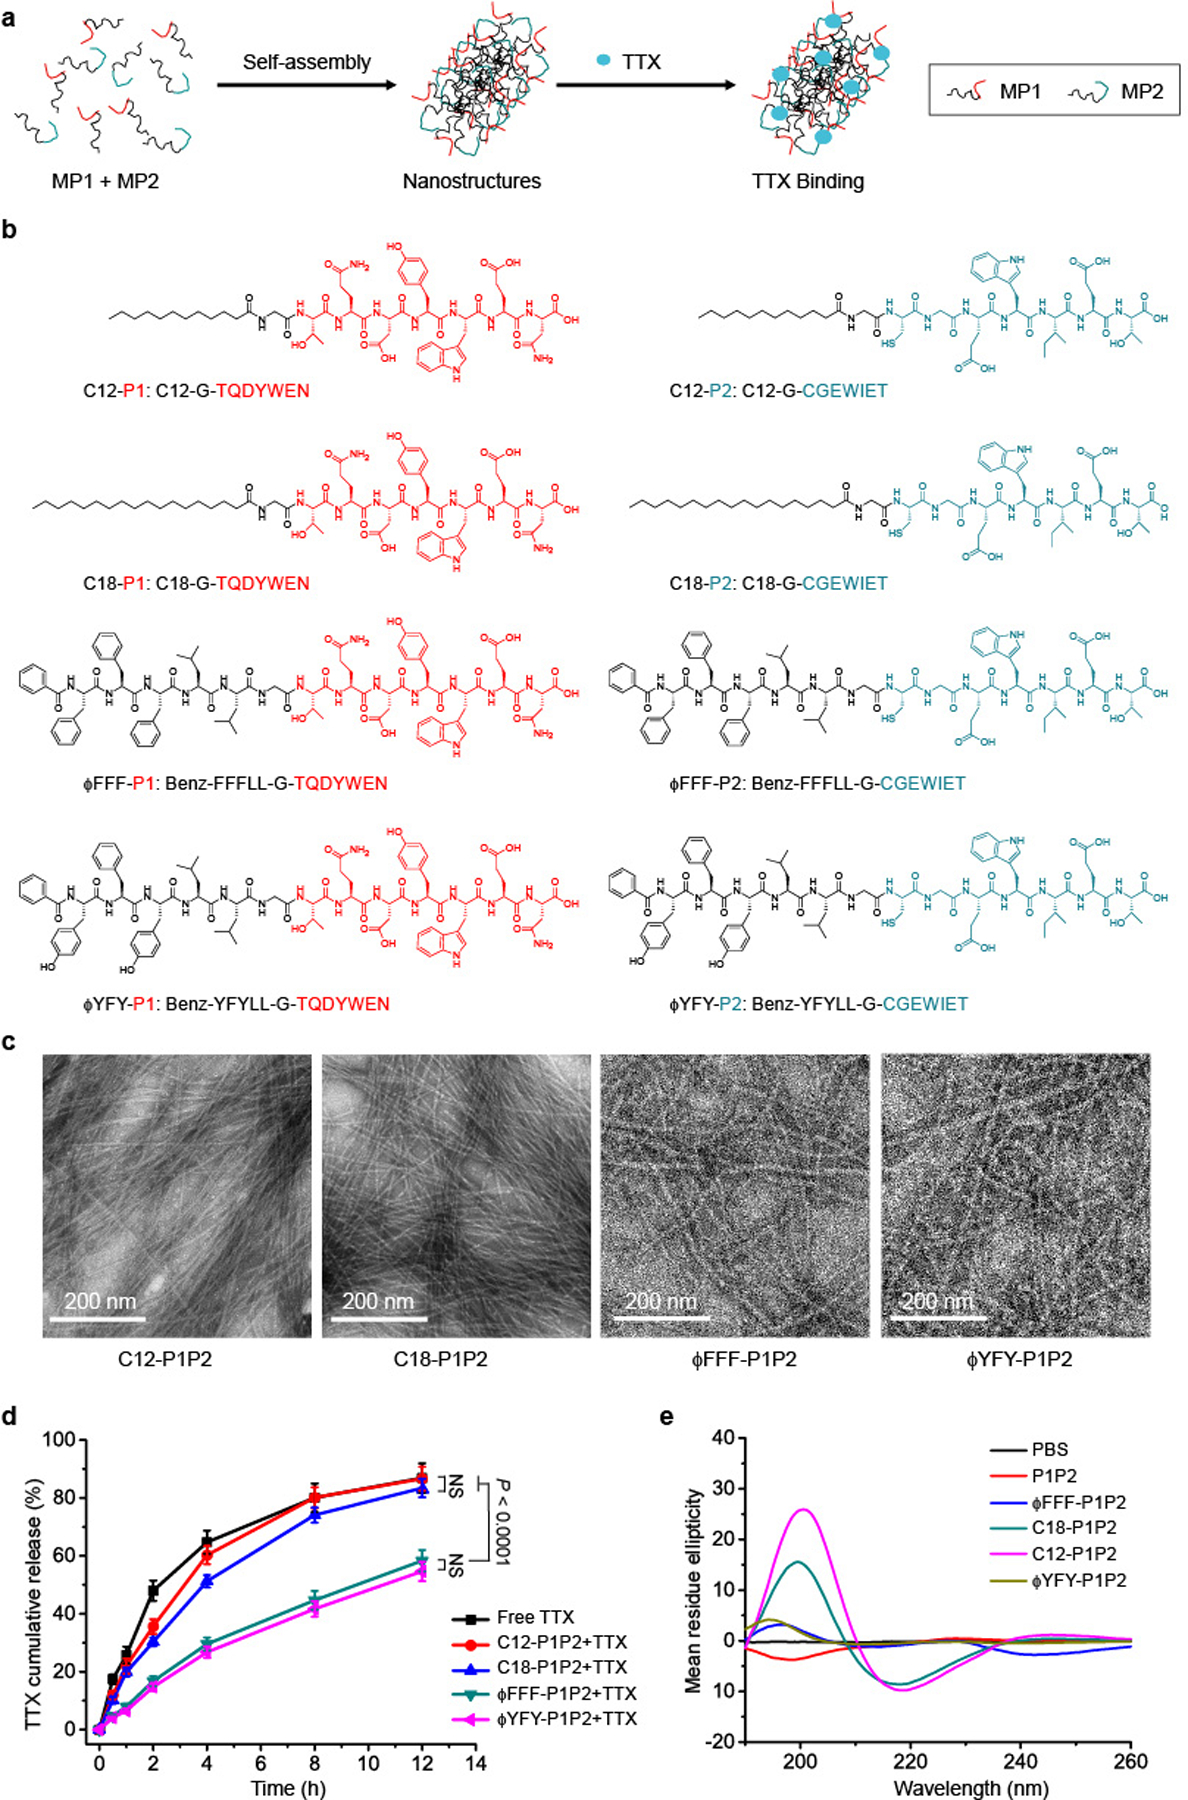
Fig. 2 |. Nanostructures of the self-assembled MP pairs.

a, Schematic of TTX binding to MPs approximated by self-assembly into nanostructures. b, MPs with different hydrophobic domains. red, P1; blue, P2. c, TEM images of different pairs of MPs. In each pair, the molar ratio of MP1:MP2 was 1:1 and the concentration was 62.6 μM. d, TTX release from each formulation over 12 h. In each group, the ratio of MP1:MP2:TTX was 1:1:1 and their concentration was 62.6 μM. The release over 48 h is shown in Supplementary Fig. 6. Data are shown as the mean ± s.d. (n = 4). ϕFFF-P1P2 + TTX and ϕYFY-P1P2 + TTX groups versus free TTX group, P < 0.0001. e, CD spectrum of each MP pair. All the peptide solutions have the same concentration (20 μM).
