
Figure 1.
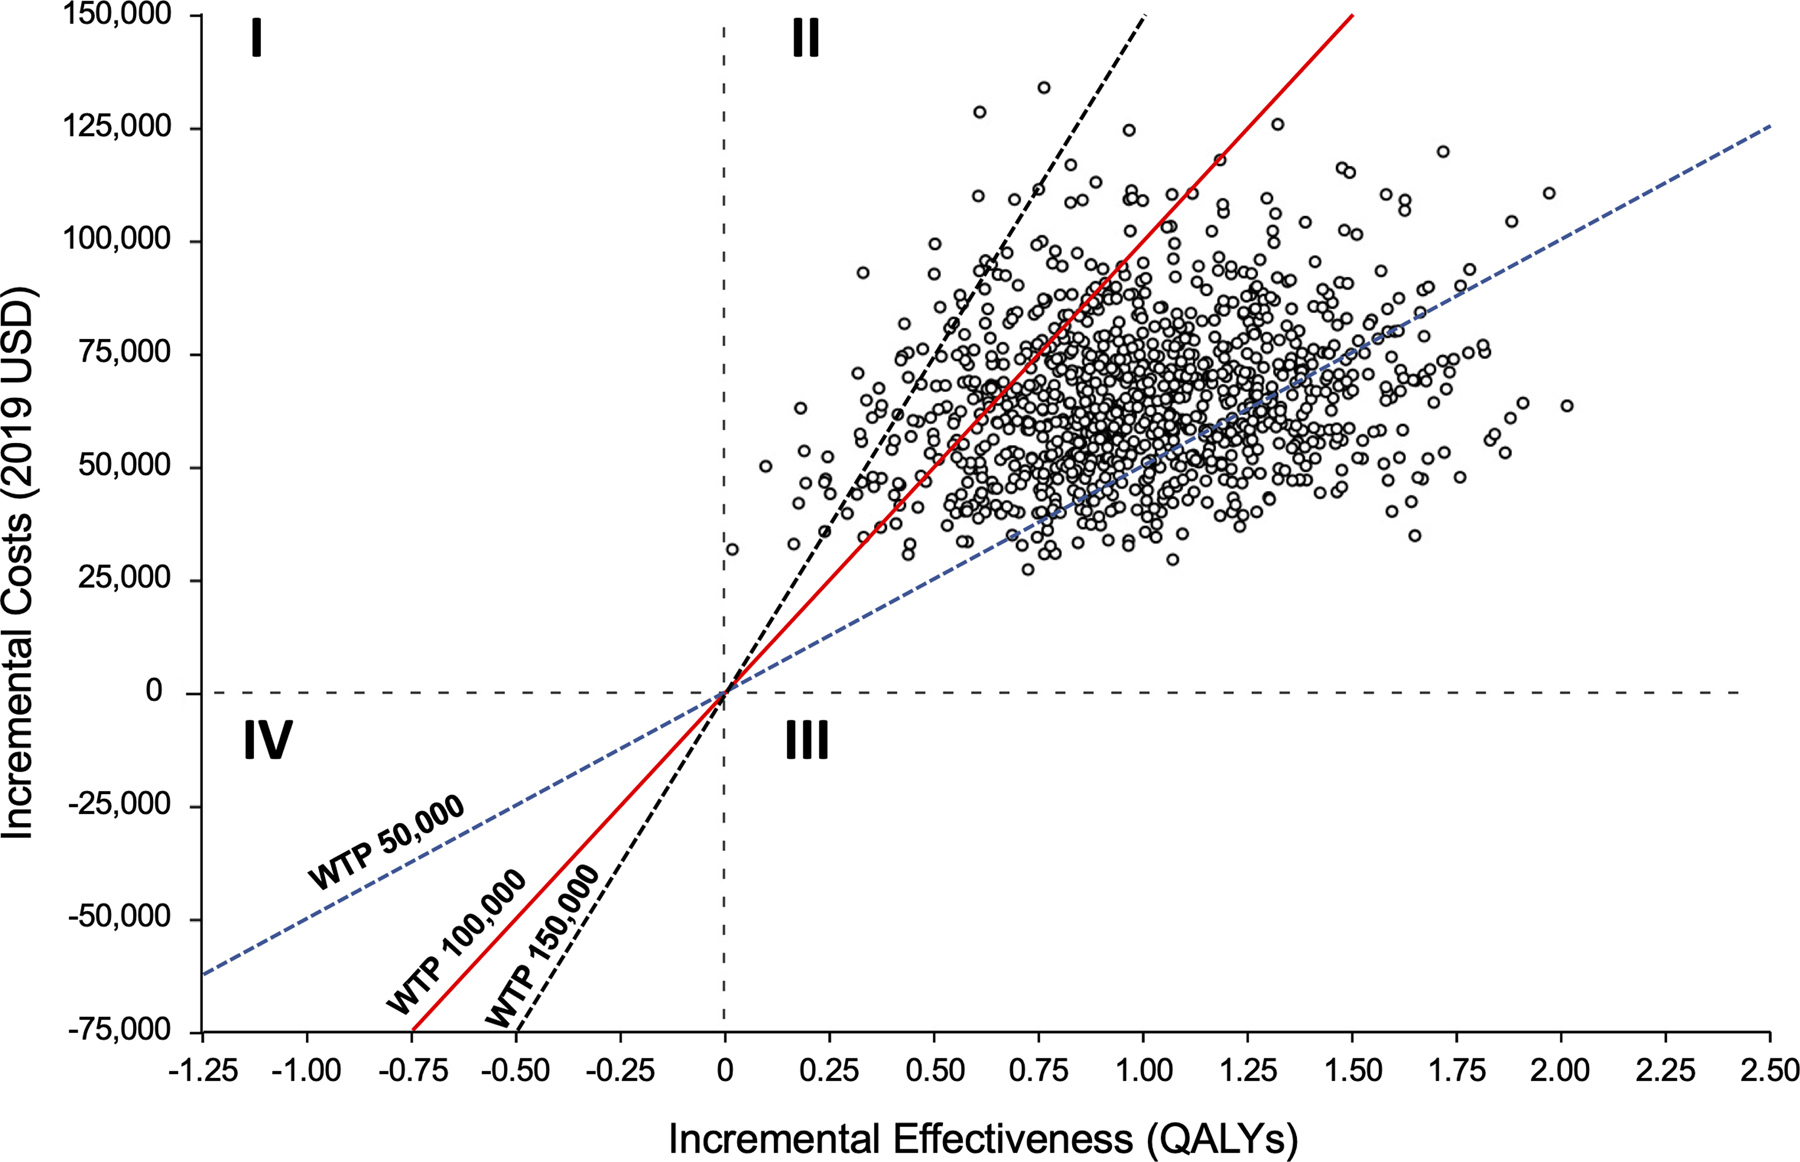
Incremental cost-effectiveness plane comparing CABG to Medical Therapy. Quadrant I represent scenarios where CABG is more costly and less effective, Quadrant II represents scenarios where CABG is more costly and effective, Quadrant III represents scenarios where CABG is less costly but more effective, and Quadrant IV represents scenarios where CABG is less costly and less effective. Abbreviations: QALY – quality-adjusted life year; WTP – willingness-to-pay; USD – United States Dollars