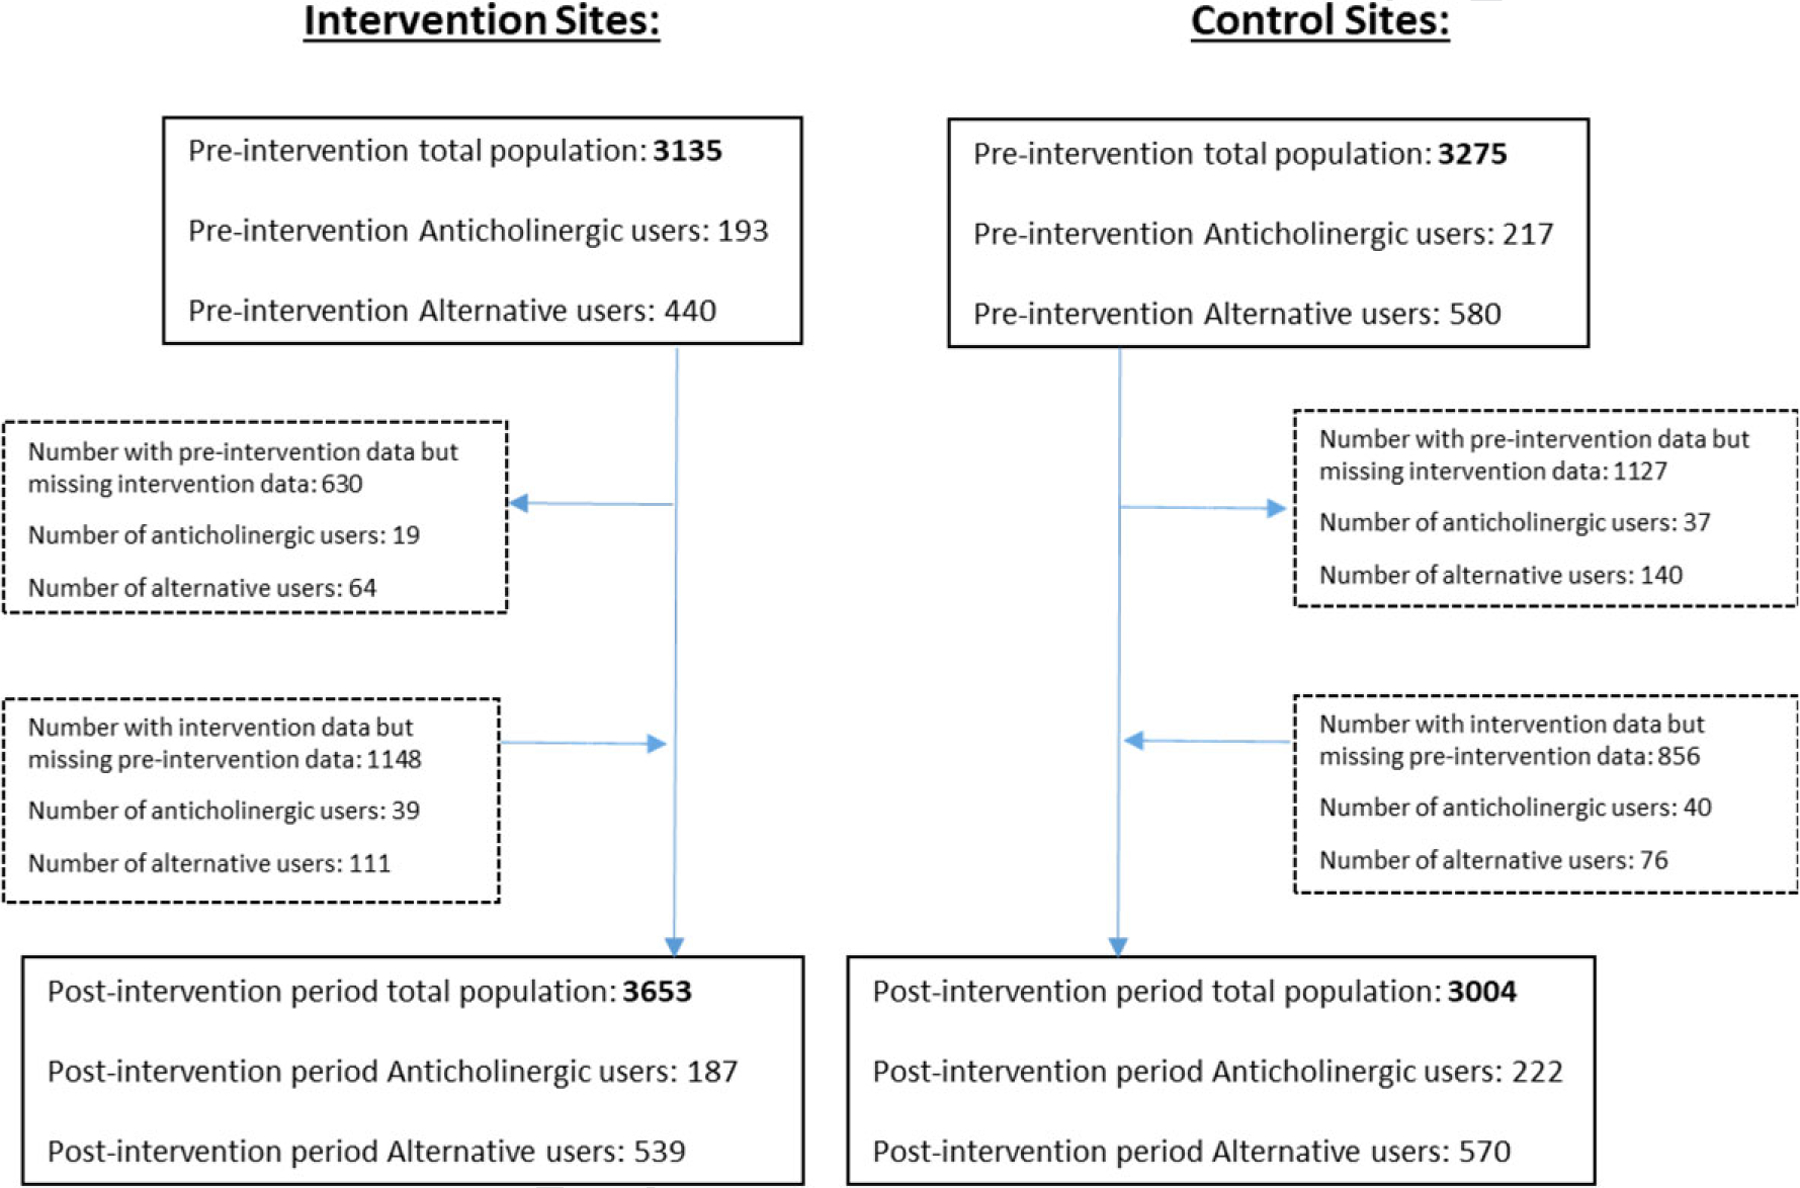
FIGURE 2.

Flow of patients by year and site. Given the change in eligible population over time, the analysis is based on unique users contributing data to preintervention and postintervention years. Participants may have contributed data in the preintervention, postintervention, or both years. Among the 380 anticholinergic users at intervention sites, 254 unique patients were included in the analysis, and among the 439 anticholinergic users at control sites, 298 unique patients were included in the analysis
