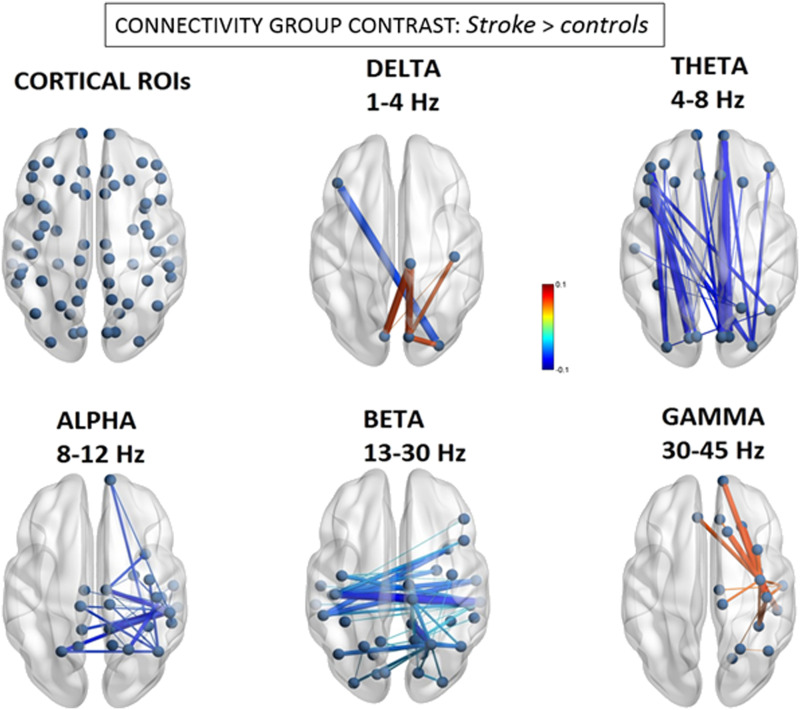
Figure 1. .
Group differences in EEG source functional connectivity. Significant differences of the magnitude of amplitude envelope correlations between stroke patients and controls. Line thickness represents larger absolute connectivity difference (Pearson’s correlation coefficient r). Red color indicates greater connectivity for patients versus controls, while blue color indicates greater connectivity for controls versus patients (only significant connectivity components are displayed, p < 0.05 network-based statistic corrected).

