Fig. 1.
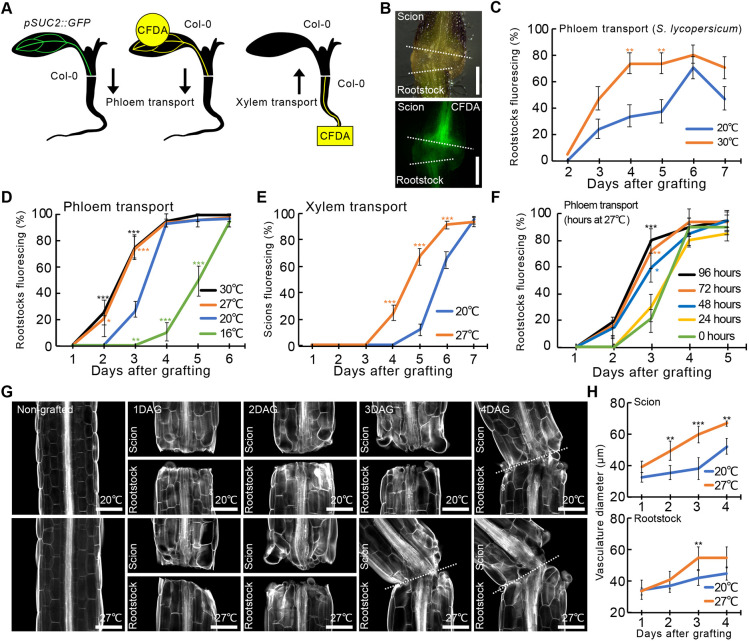
Elevated temperatures enhance graft formation. (A) Schematic showing phloem and xylem transport measured by appearance of GFP or CFDA fluorescence in the rootstock (phloem) or CFDA fluorescence in the scion (xylem). (B) Movement of CFDA from scion to rootstock of grafted tomato. Dashed lines indicate cut sites. (C) Proportion of grafted tomato that transported CFDA to rootstocks after recovery at 20°C or 30°C [±standard error of a proportion (s.e.p.); n=27 at 1 DAG, n=30 at 2-7 DAG per temperature per time point]. (D) Proportion of grafted pSUC2::GFP Arabidopsis scions with fluorescing Col-0 rootstocks (±s.e.p.; n=20 at 16°C, n=60 at 20°C, n=20 at 27°C, n=20 at 30°C). (E) Proportion of grafted Arabidopsis that transported CFDA to scions after recovery at 20°C or 27°C (±s.e.p.; n=50 plants per temperature per time point). (F) Proportion of grafted pSUC2::GFP Arabidopsis scions with fluorescing Col-0 rootstocks that were recovered at 27°C for the indicated period, then transferred to 20°C recovery (±s.e.p.; n=40 plants per temperature). (G) Longitudinal optical sections of grafted Arabidopsis recovered at 20°C and 27°C. Plants are stained with Calcofluor White and dashed lines indicate the cut site. (H) Vasculature diameter including pericycle, cambium, xylem and phloem of grafted Arabidopsis, 100 µm from the cut surface and recovered at 20°C or 27°C (mean±s.d.; n=10 plants per temperature per time point). *P<0.05, **P<0.01, ***P<0.001; Fisher's exact test (C-F) or unpaired two-tailed Student's t-test (H) compared with 20°C. Scale bars: 500 μm (B); 100 µm (G).

