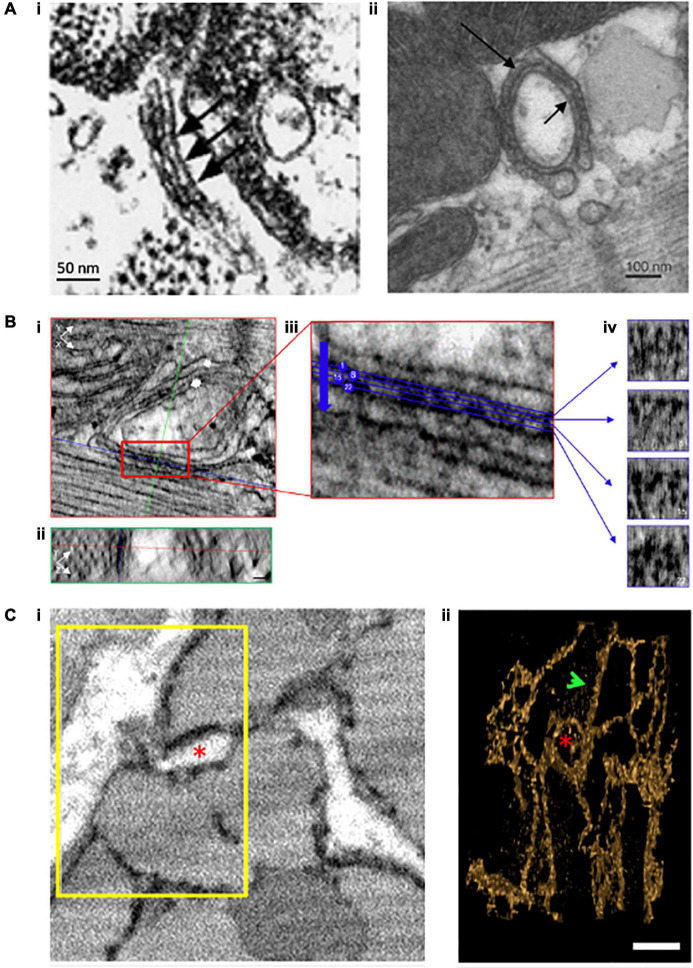
FIGURE 2.
Evolving understanding of dyadic structure from electron microscopy (EM) studies. Visualization of dyads was first enabled by EM, as early as the 1960s. Even with 2D applications of this technique (A), dyadic junctions between the jSR and the cell surface [(i), chick myocardium, (Franzini-Armstrong et al., 1998)] or t-tubules [(ii), rat ventricular myocyte, (Novotová et al., 2020)] were readily apparent, and highlighted the tight geometry of the dyadic cleft. Electron dense “feet” visible in the cleft (arrows) were attributed to the cytosolic portion of the RyR. With the advent of tomography techniques and enhanced contrast agents, it became possible to assess the 3D orientation of individual RyRs within dyads (B, scale bars = 30 nm, Asghari et al., 2020). XY (i) and YZ (ii) orthagonal views are presented for a representative dyad (single arrow = jSR, double arrow = t-tubule). Indicated planes are positioned on a single RyR (red line = XY, blue line = XZ, and green line = YZ plane). (iii) A magnified view of the boxed region in ii illustrates selected sections (4 of 28 illustrated) taken across the dyadic cleft. Each of these four sections is presented in (iv), allowing identification of the position and orientation of individual RyRs. Full 3D rendering of cardiomyocytes has been made possible by serial block face imaging coupled with scanning EM (C, Colman et al., 2017). (i) The presented 2D image from a sheep cardiomyocyte illustrates dyadic junctions between t-tubules (white) and the electron dense SR (black). Reconstruction of the boxed region in 3D (ii) illustrates both network SR (arrow) and the jSR encircling a t-tubule (asterisk). Copyright permission was obtained for the reproduction of Panel (Ai) (Franzini-Armstrong et al., 1998). Copyright permission was not required to reproduce the other figures.

