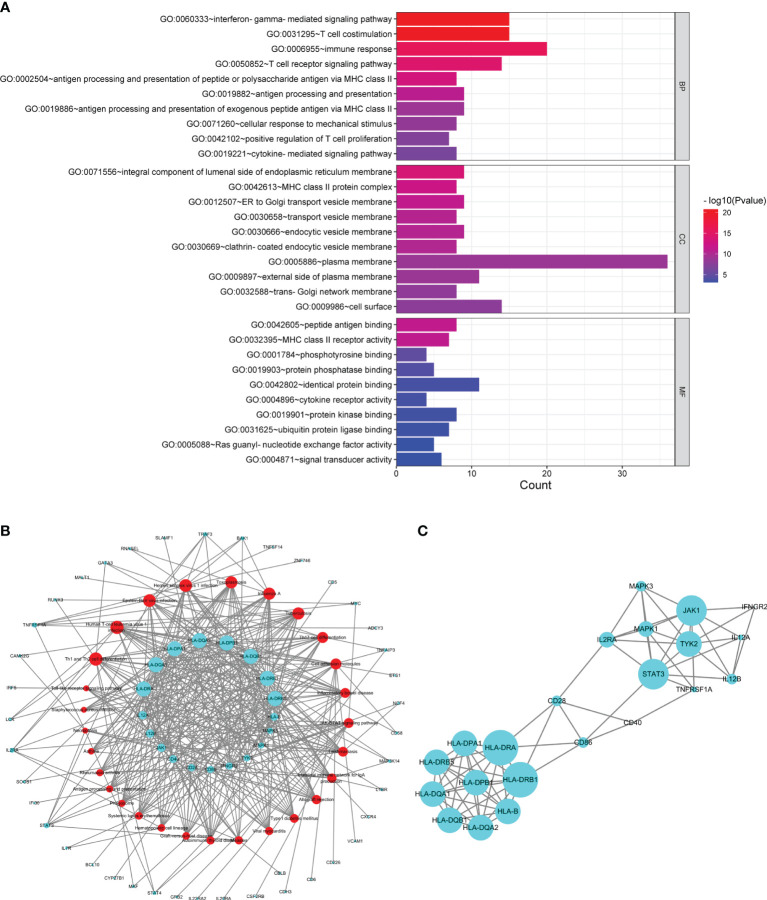
Figure 3.
Analysis of common susceptibility genes. (A) Top 10 GO terms in the biological process, cellular component, and molecular function categories of common susceptibility genes. (B) Common susceptibility pathway–common susceptibility gene network. The red nodes represent pathways, and the green nodes represent genes. (C) Protein–protein interaction network of common susceptibility genes.

