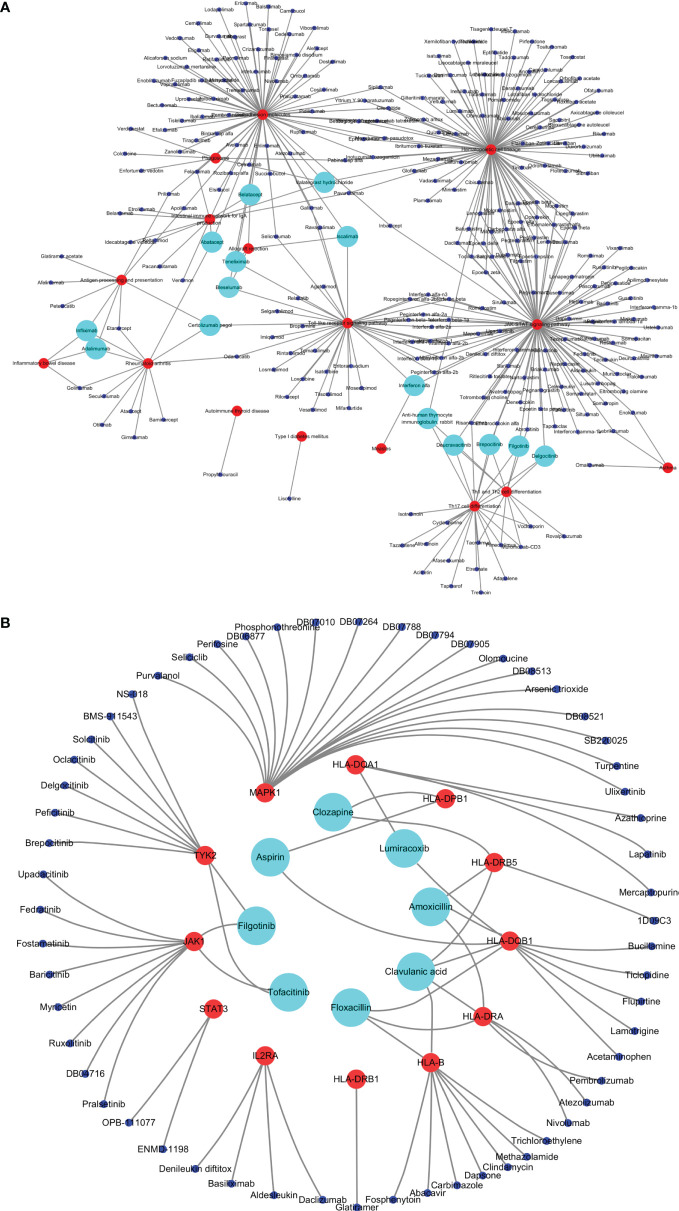
Figure 5.
Drugs targeting common susceptibility pathways/genes. (A) Drugs–common susceptibility pathways interaction network. The red nodes represent pathways, the blue nodes represent drugs, and the green nodes represent drugs targeting more than or equal to three pathways. (B) Drugs–hub common susceptibility genes interaction network. The red nodes represent genes, the blue nodes represent drugs, and the green nodes represent drugs targeting more than or equal to two genes.

