FIGURE 7.

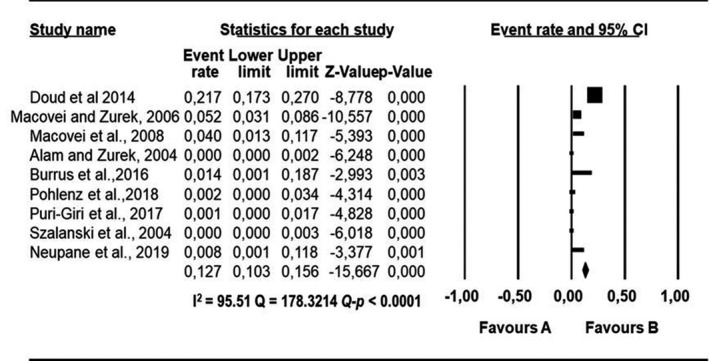
Forest plot showing the pooled estimates of Enterococcus faecium proportion isolated from houseflies. The squares demonstrate the individual point estimate. The diamond at the base indicates the pooled estimates from the overall studies

Forest plot showing the pooled estimates of Enterococcus faecium proportion isolated from houseflies. The squares demonstrate the individual point estimate. The diamond at the base indicates the pooled estimates from the overall studies