Abstract
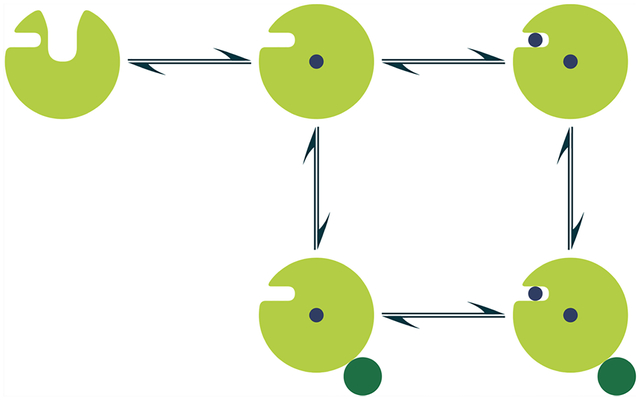
Cytochrome P450cam (CYP101A1) catalyzes the region- and stereo-specific 5-exo-hydroxylation of camphor via a multistep catalytic cycle that involves two-electron transfer steps, with an absolute requirement that the second electron be donated by the ferrodoxin, putidaredoxin (Pdx). Whether P450cam, once camphor has bound to the active site and the substrate entry channel has closed, opens up upon Pdx binding, during the second electron transfer step, or it remains closed is still a matter of debate. A potential allosteric site for camphor binding has been identified and postulated to play a role in the binding of Pdx. Here, we have revisited paramagnetic NMR spectroscopy data and determined a heterogeneous ensemble of structures that explains the data, provides a complete representation of the P450cam/Pdx complex in solution, and reconciles alternative hypotheses. The allosteric camphor binding site is always present, and the conformational changes induced by camphor binding to this site facilitates Pdx binding. We also determined that the state to which Pdx binds comprises an ensemble of structures that have features of both the open and closed state. These results demonstrate that there is a finely balanced interaction between allosteric camphor binding and the binding of Pdx at high camphor concentrations.
Graphical Abstract
INTRODUCTION
Cytochromes P450 are a superfamily of b-type heme mono-oxygenases that have been identified throughout the three kingdoms of life.1 Their roles in mammals include xenobiotic metabolism, steroid biosynthesis, oxidation of fatty acids, hormone synthesis, and breakdown, and they play a pivotal role in the clearance of numerous compounds. The most widely studied of these enzymes, cytochrome P450101A1, also known as P450cam, catalyzes the regio- and stereo-specific hydroxylation of D-camphor to 5-exo-hydroxycamphor in the soil bacterium Pseudomonas putida, to use camphor as an energy source (Figure 1). P450cam was the first member of the P450 superfamily to be sequenced, purified in significant quantities, and to have its structure solved by X-ray crystallography.2–4 Consequently, P450cam has served as the archetype for studies on P450 systems.
Figure 1.
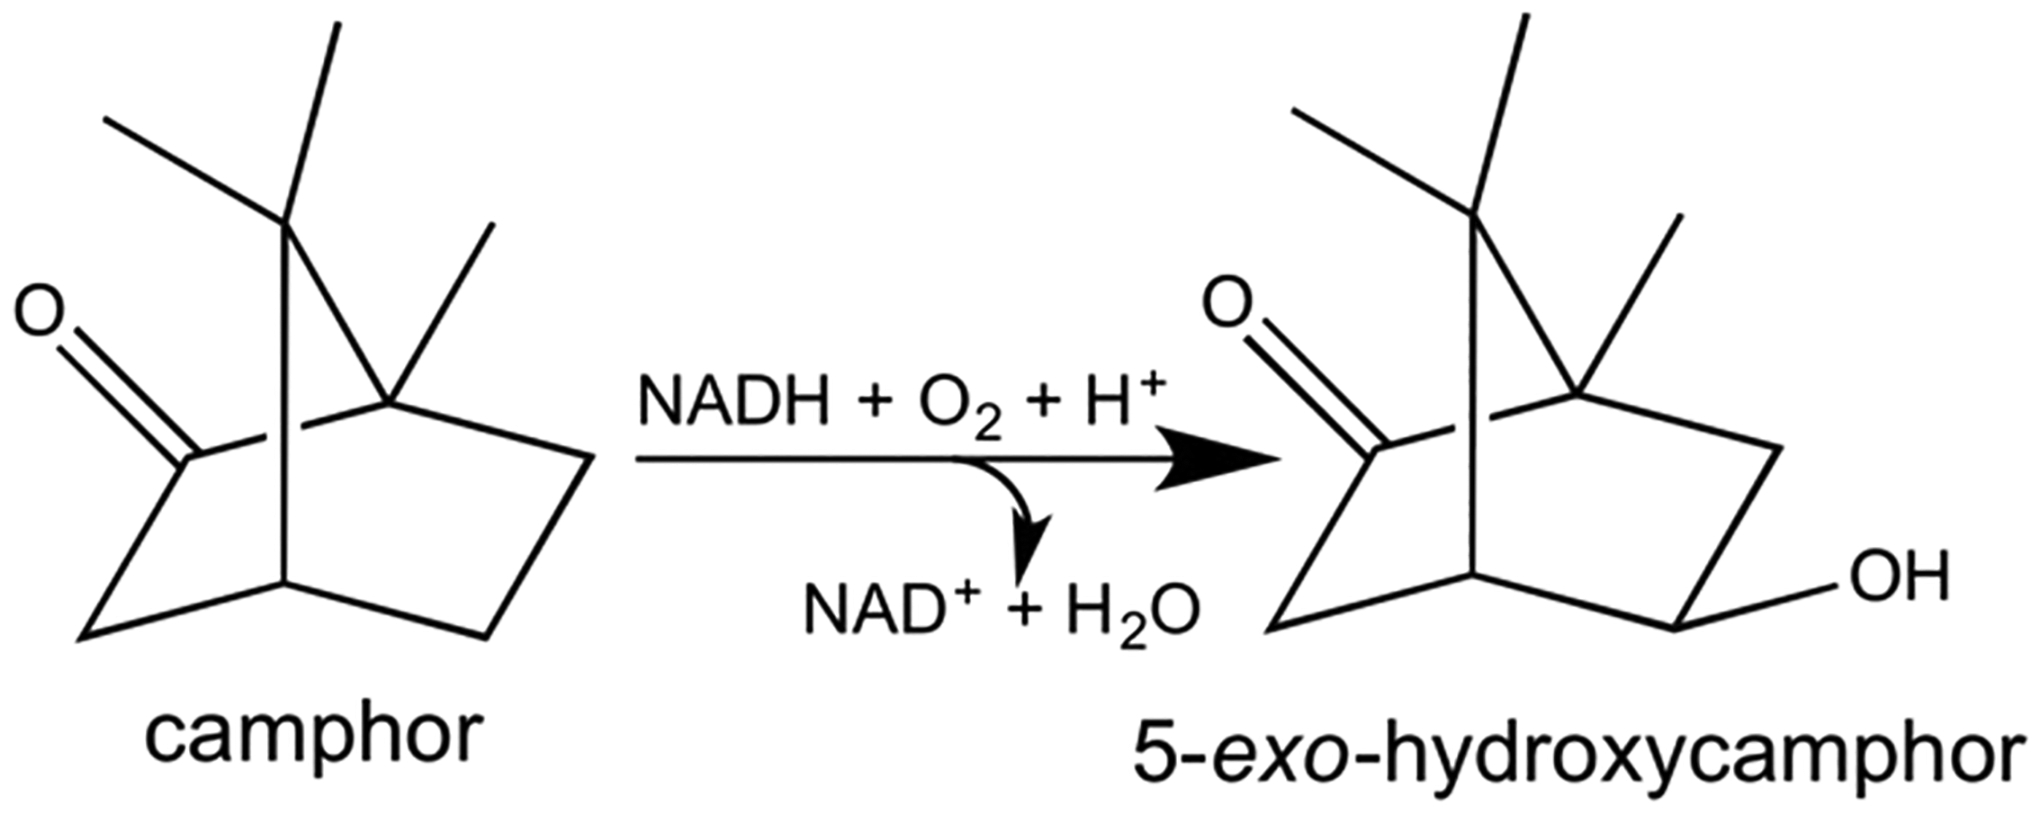
Hydroxylation of camphor to 5-exo-hydroxycamphor.
Cytochromes P450 all share a common catalytic cycle, which proceeds via a series of ordered steps that reduce molecular dioxygen and couple it to substrate oxidation, enabling oxygenation reactions. This reduction is achieved by two-electron transfer steps, and the electron donor(s) vary among P450s. In the case of P450cam, the first electron transfer can be performed by different reductants, but there is an absolute requirement that the second electron is provided by the P. putida ferredoxin, putidaredoxin (Pdx). It has also been postulated that Pdx plays an effector role in the catalytic cycle,5,6 as well as serving as an electron donor.
P450cam in the absence of the substrate adopts an open conformation with a substrate entry channel flanked by the B′, F, and G helices.7 On binding of the substrate to the active site, a water molecule ligated to the heme is displaced, resulting in a pentacoordinate high-spin heme and a closed conformation, with the B′, F, and G helices closing over this channel7,8 (Figure 2A). Subsequent to this, the two-electron transfer steps occur. Intriguingly, the first two X-ray crystallography structures of the P450cam-Pdx complex, both published in 2013, while overall very similar (Cα RMSD of 0.85 Å), differ in the conformation of B′, F, G, and I helices, one showing the substrate entry channel of P450cam in an open conformation,9 and the other showing this channel in an intermediate conformation between open and closed states.10 Subsequently, solution-state paramagnetic NMR studies demonstrated that Pdx binds to the closed state of P450cam.11 These findings led to two alternative models for the second electron transfer step of the P450cam catalytic cycle. In one, the substrate entry channel remains closed after the substrate binds at the active site and for the remainder of the catalytic cycle. In the other model, Pdx binding opens the substrate entry channel to enable the formation of a water-mediated proton relay network, which provides the two protons required for hydroxylation. The latter model is supported by the observation of a Pdx-induced shift to the open state, using EPR spectroscopy, isothermal calorimetry, and MD simulations.5,12,13
Figure 2.
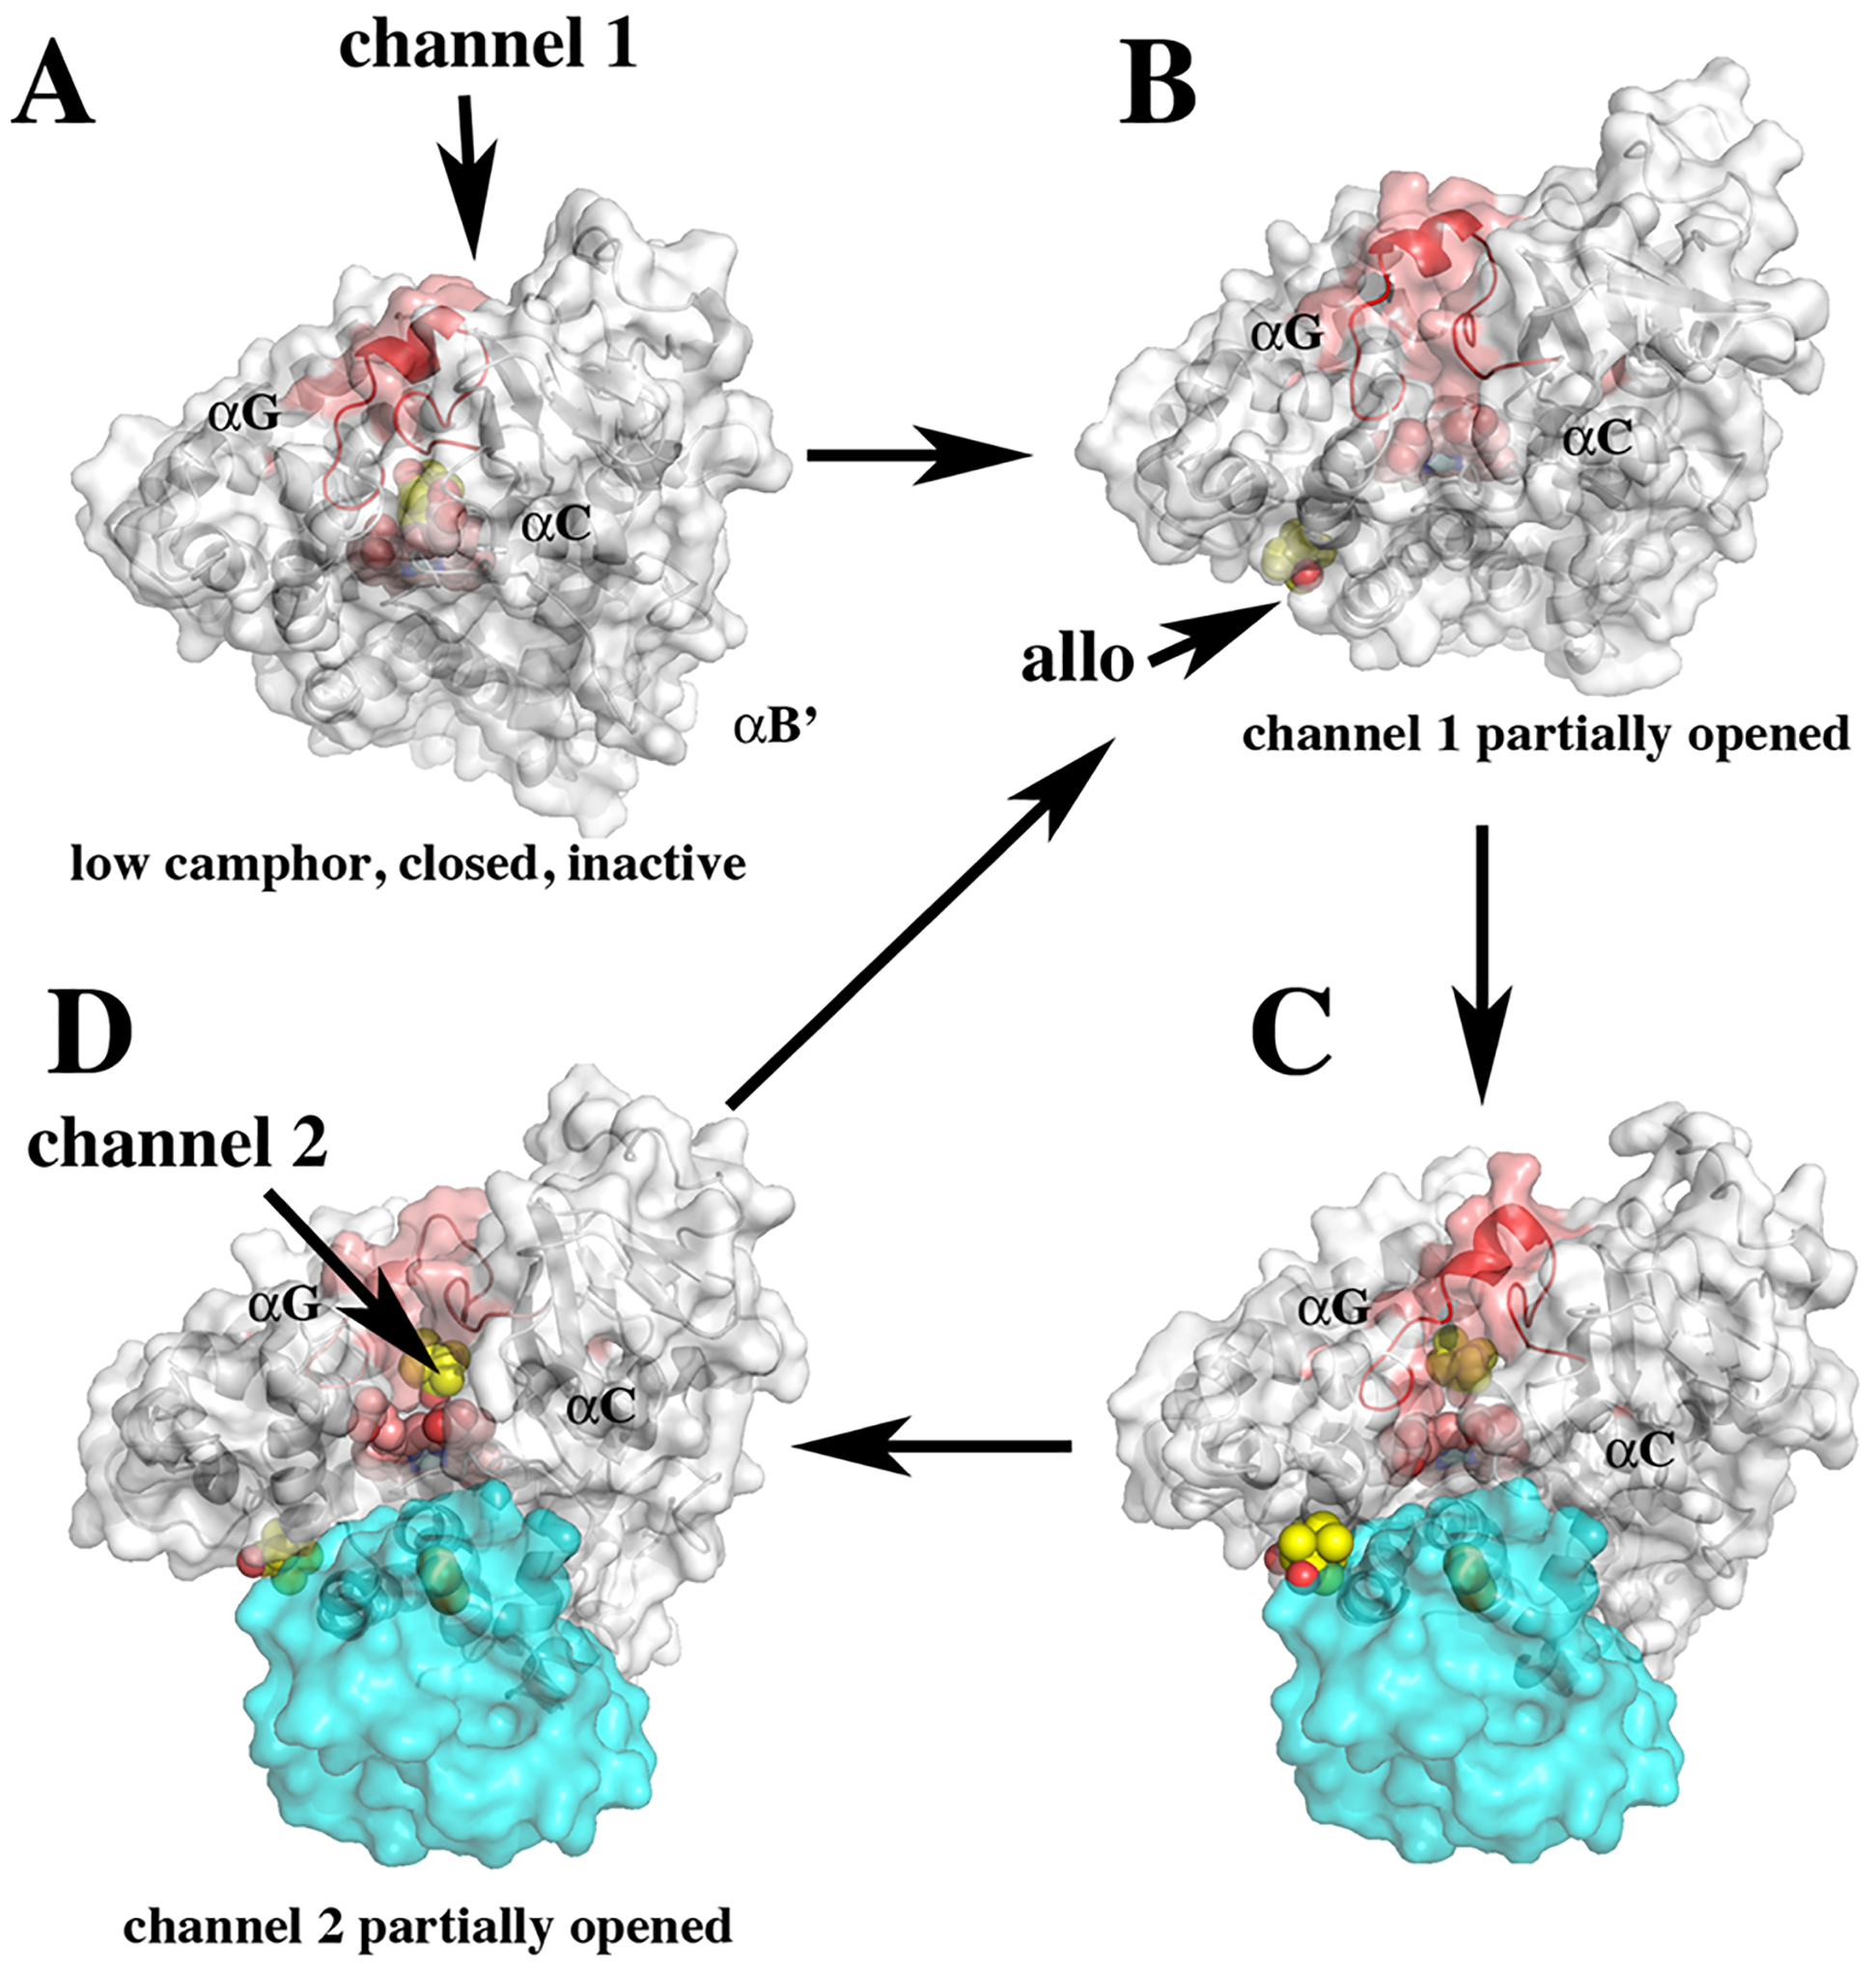
Various conformational states consistent with crystal structures, NMR, and molecular dynamics. (A) At low-camphor concentrations, camphor is bound in the active site and P450cam is in the closed inactive state. (B) At higher camphor concentration, the allosteric site is occupied, channel 1 opens, and Pdx binds (C). These events destabilize the salt bridges to Asp251, which triggers the formation of the proton relay network required for O2 activation. (D) Product forms and channel 2 opens, thereby enabling product egress. The B′ helix provides key contacts with the substrate. Helix F that undergoes the large open/close motion is labeled.
An allosteric binding site for camphor in P450cam was observed in MD simulations14 at the base of the F and G helices (Figure 2B); simulations also showed that camphor caused the opening of an egress channel, denoted channel 2, below the camphor allosteric binding site (Figure 2D). A structure of the P450cam/Pdx complex in the presence of camphor and cyanide15 showed that the substrate entry channel is closed, and channel 2 is open in the presence of Pdx. This structure also showed that binding of cyanide results in significant conformational changes and two different rotamers for D251, suggesting that the salt bridge between D251 and R186 may intermittently break to allow D251 to participate in proton transfer to dioxygen.
A pseudocontact shift (PCS) is the difference in chemical shift observed for a nucleus between paramagnetically and diamagnetically tagged proteins.16 PCSs are very sensitive to structural changes within a protein system and can provide long-range distance information. A PCS depends on the distance and orientation of the vector between the observed nucleus and the paramagnetic center, where the orientation is given relative to the frame defined by the anisotropic component of the magnetic susceptibility of the paramagnetic center, described by the Δχ tensor. When a paramagnetic tag is attached to part of a protein that assumes different conformations relative to a nucleus elsewhere in the protein, the vector between the nucleus and the paramagnetic center will change.
The PCSs used in this study were acquired by mutating residues, E195 and A199 of P450cam to Cys, for attachment of the two-armed caged lanthanoid NMR probe-7 (CLaNP-7)17 (Figure 3). We have previously shown that open conformation can be observed with this probe attached, and therefore, this probe does not perturb the structure of P450cam.11 The mutation sites are located at the N-terminal end of the G-helix, which changes conformation significantly when the protein transitions from the open to the closed state. No crystal structure to date could explain the complete set of PCS. Previously, only a subset of these PCS could be used to obtain a Δχ tensor from the crystal structures of P450cam, and residues for which PCSs could not be reliably back-predicted were deemed to be “mobile” residues;11 several of these residues are located within, or close to, the proposed allosteric site.14
Figure 3.
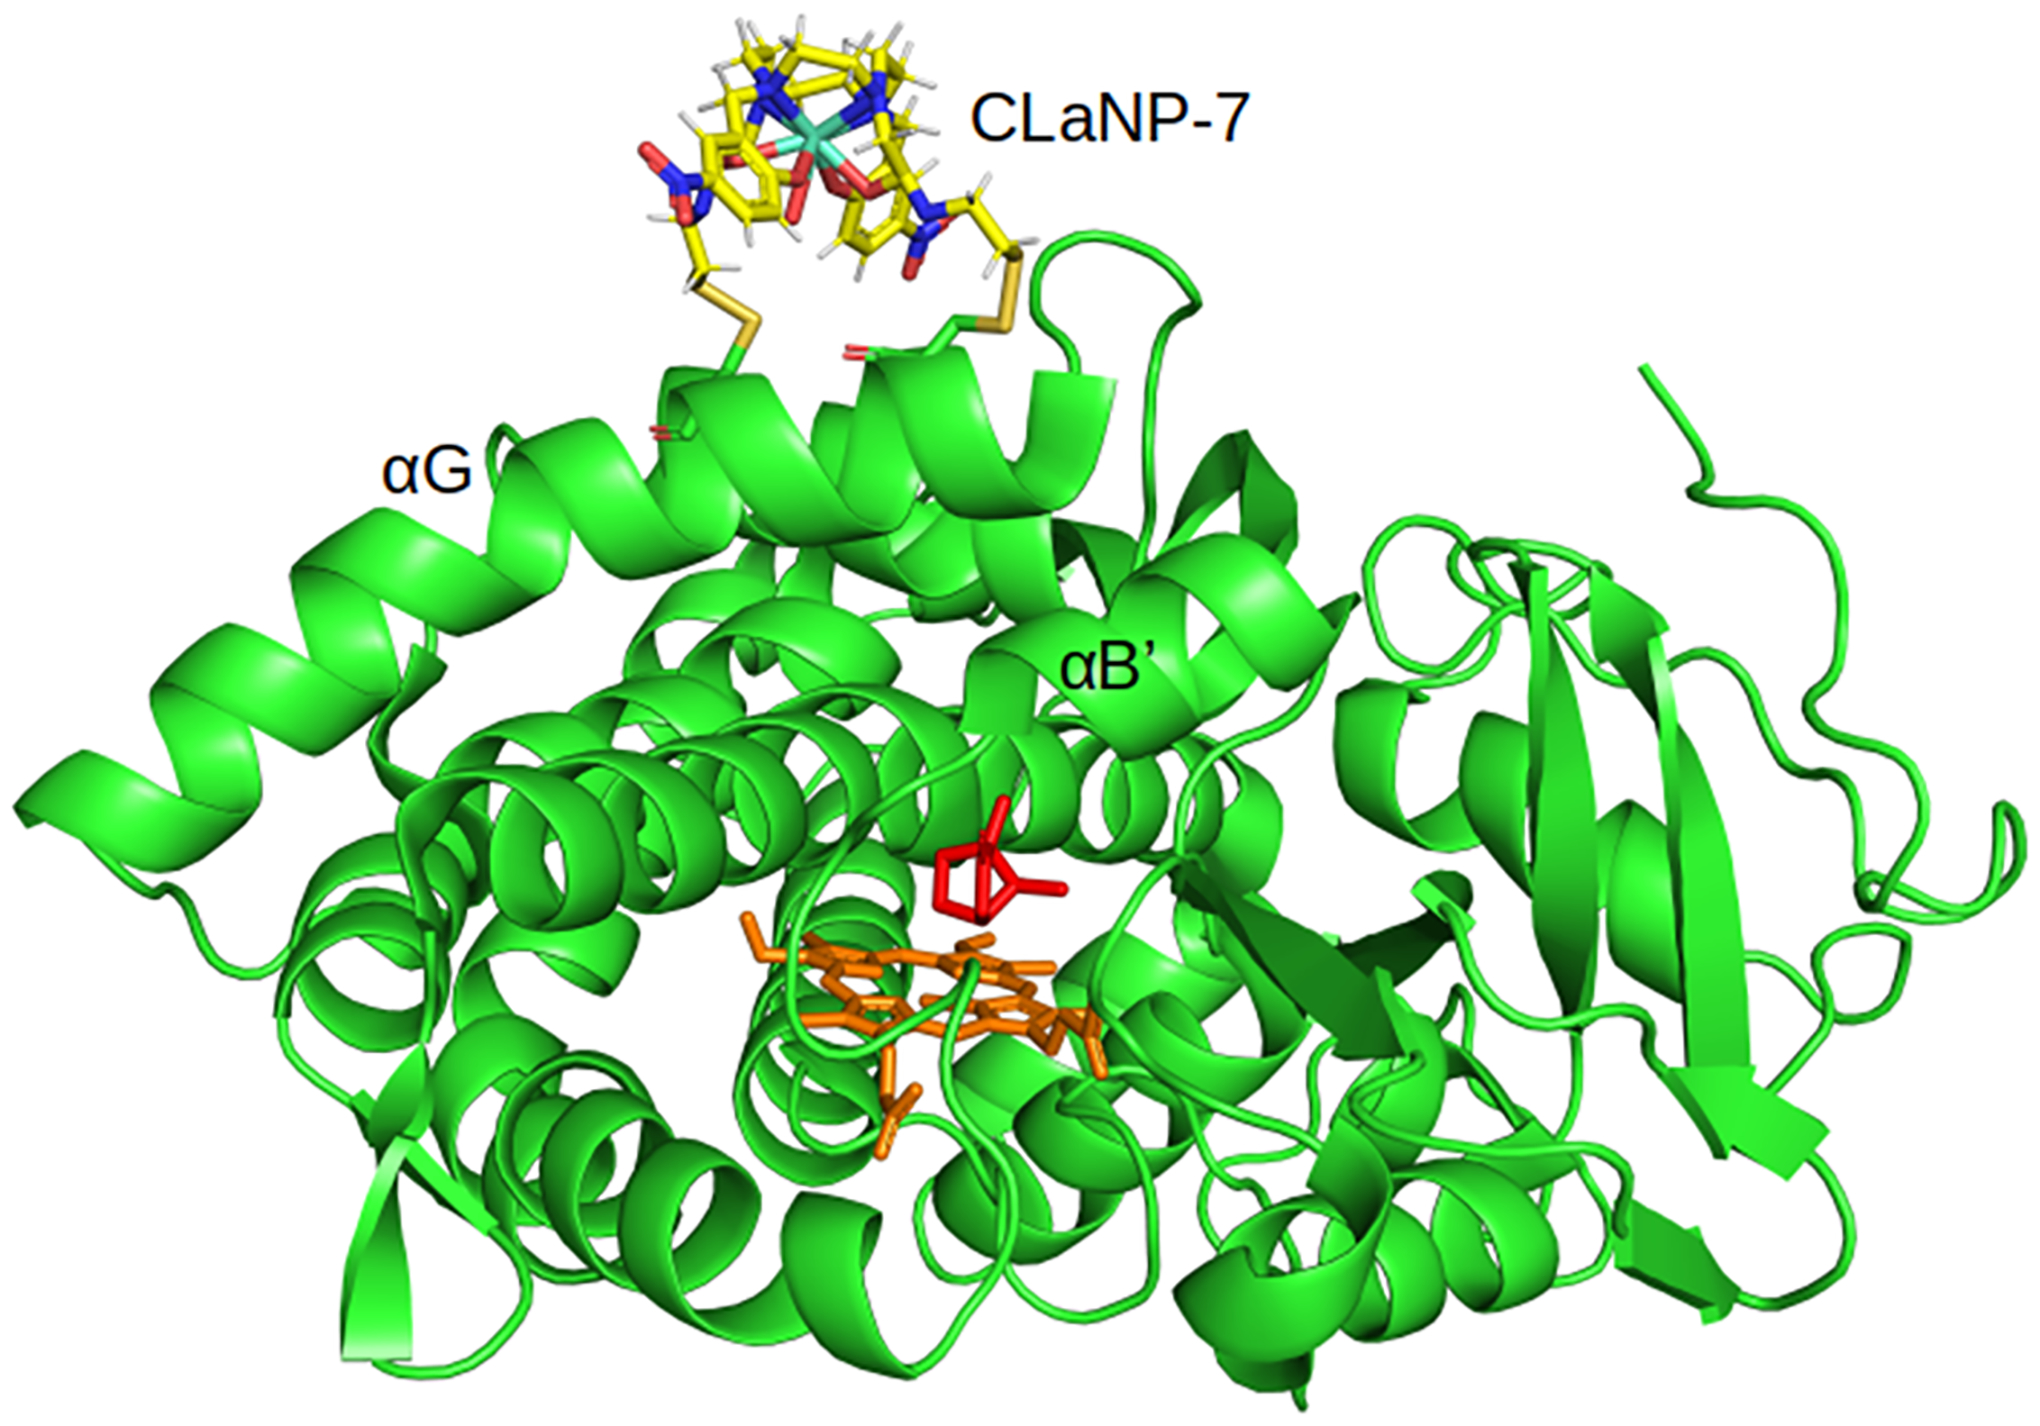
Model of P450cam [camphor-bound, closed state; PDB code 3L637] with mutations E195C and A199C (cartoon), linked to CLaNP-7 (yellow sticks). The heme is shown as orange sticks and the active site camphor molecule is shown as red sticks. The G-helix that contains residues 195 and 199 is labeled along with the B′ helix.
In this study, we show that a subset of structures sampled by molecular dynamics simulations17 that contain the allosteric site satisfy PCS data. Hence, the presence of the allosteric site on P450cam in solution, not observed in any crystal structure available, is confirmed by NMR pseudocontact shifts.11 The results provide compelling evidence of the presence of the allosteric camphor binding site, and that there is an interplay between camphor binding to this site and Pdx binding. We also determined that the conformations to which Pdx binds resemble the closed crystal structure rather than the open one, but that some of the hallmarks of the open structure are present in this state.
METHODS AND MATERIALS
The sets of structures used in this study are comprised of all frames from all trajectories of two molecular dynamics simulations previously published.13,14 The P450cam/Pdx set comprises 30 000 frames from six 100 ns trajectories, containing Pdx and P450cam with camphor bound in the active site. The 3cam set comprises 5000 frames from five 1 μs trajectories of P450cam in the presence of three camphor molecules. All frames in each ensemble were rotated and translated, using the CPPTRAJ software,18 to ensure that the G helices (residues 193–213) were overlaid by minimizing the RMSD of the Cα atoms of the G-helix relative to the first frame.
Molecular Dynamics.
Molecular dynamics (MD) simulations were performed as previously described.14,19,31 In brief, the P450cam open structure (PDB code 4JX19) was used, with Pdx present for the P450cam/Pdx set and with Pdx was removed for the 3cam set. This structure exhibits a Cα atom rms deviation of 0.37 Å from the open P450cam crystal structure solved without Pdx (3L62), but the entire protein is clearly defined in 4JX1 electron density maps.7 Therefore, no modeling of missing residues was required to obtain a complete structure for MD simulations. For both sets, the protein was solvated with a 10 Å cushion in a rectangular box of TIP3 waters and was neutralized with Na+ ions. D297, which is buried in the active site and forms a H-bond with a heme propionate, was protonated. In the simulations of the 3cam set, camphor was placed manually with one molecule near the known entry channel. The second and third were placed near the cutoff distance for long-range interactions (~10 Å from the protein). For the P450cam/Pdx set, no additional camphor molecules were added. Structures were minimized for 1000 cycles, allowing only H atoms and solvent molecules to move followed by an additional 1000 cycles where all atoms were allowed to move. Production runs for the P450cam/Pdx set were carried out using Amber 1420 with a 2 fs time step, and six runs were performed for 100 ns with each run having a different initial velocity (ig = −1). Production runs for the 3cam set were carried out using Amber 16 using 2 fs steps suggested by the SHAKE algorithm.21 Five runs were performed for 1 μs also using a random initial velocity.
NMR Spectroscopy.
The two sets PCSs used in this work, namely, 1HN PCS of camphor-bound P450cam with CLaNP-7 attached and 1HN Leu PCS of the P450cam/Pdx complex with camphor-bound, were obtained and published previously. To obtain the 1HN PCS of camphor-bound P450cam, samples of 15N-2H labeled CLaNP-7-tagged P450cam and Pdx were produced according to the protocol published by Hiruma et al. and 15N-Leu labeled CLaNP-7-tagged P450cam was prepared according to the protocol published by Skinner et al.11 Subsequently, to measure 1HN PCS, 15N-1H TROSY-HSQC spectra were acquired using 100 μM P450cam dissolved in 50 mM Tris–HCl (pH 7.4) containing 1 mM camphor, 1% (vol/vol) methanol, and 100 mM KCl at 298 K. To measure 1H-Leu PCS for the P450cam/Pdx complex, 15N-1H TROSY-HSQC spectra were obtained using 175 μM P450cam and 435 μM Pdx dissolved in 20 mM HEPES (pH 7.5) containing 1 mM camphor, 1% (vol/vol) methanol, and 100 mM KCl at 298 K. Spectra were obtained for P450cam with Lu- and Yb-CLaNP-7 attached, and 1HN PCS were calculated as the difference between the 1H chemical shifts from the spectra of the paramagnetically (Yb) and diamagnetically (Lu) tagged samples.
Determination of the Δχ Tensor and PCS Prediction.
The Δχ tensor for the E195C/A199C/C334A mutant of P450cam for each of the P450cam-Pdx and 3cam sets was determined using an ensemble-averaged fit, in which a single tensor is fit to all frames in that set simultaneously, using the Paramagpy software.22 The initial position of the lanthanoid ion was determined using an ensemble-averaged singular value decomposition (SVD) grid search, in a sphere of 10 Å radius with 10 points per radius, using the previously published tensor for the closed state of P450cam as the starting point. Subsequently, the Δχ tensor was determined for each simulation using an unconstrained ensemble-averaged fit, using the Broyden–Fletcher–Goldfarb–Shanno (BFGS) algorithm.23 Δχ tensors were determined using 161 1HN PCS observed for the E195C/A199C/C334A mutant.11 The reliability of each Δχ tensor was assessed according to the ensemble-average distances between the Cα atoms of E195 and A199 and the lanthanoid ion, the magnitudes of the axial and rhombic components of the Δχ tensor, and the ensemble-averaged Qa score.24 In the event that a physically feasible position of the lanthanoid ion could not be obtained from an unconstrained fit (Supporting Information), the position of the lanthanoid was constrained to a 2 Å sphere around the initial position.
Analysis of Predicted PCS.
We identified residues for which their predicted PCS are multimodal using the diptest R library,25 which tests the null hypothesis of a unimodal distribution. PCS distributions with a p-value smaller than 0.05 were selected since only multimodal PCS distributions are relevant to identify clusters of structures with common features across the samples. The multivariate distribution of such PCSs is used to identify clusters. A heatmap was used to evaluate the correlation between these residues. A dendrogram for the samples was used to find a plausible number of underlying clusters. We used model-based clustering,26 which assumes that the multivariate distribution of the PCS follows a mixture of Gaussians, to identify the clusters and estimate their means and covariances. For the covariances, we used the structure with equal variances (EEI). The number of clusters was chosen based on the Bayesian information criterion27,28 (BIC) and whether the distance between the means of the clusters was meaningful. The obtained clusters were compared with the clusters obtained using model-based clustering with a flexible covariance structure. Finally, the properties with most information about the underlying clusters were detected by visual inspection of the cluster means and the histograms.
RESULTS
Molecular Dynamics.
Given that none of the crystal structures available explain the PCS data obtained in solution, we used sets of structures obtained by molecular dynamics simulations of P450cam in the presence and absence of Pdx previously published.13,14 Simulations of P450cam performed in complex with Pdx and camphor (the P450cam/Pdx set) did not reveal the presence of channel 2. Simulations in the absence of Pdx and in the presence of 3-fold excess camphor (the 3cam set) showed instead that channel 2 opens as a result of allosteric camphor binding. Two of the trajectories in the P450cam/Pdx set started from the P450cam/Pdx crystal structure showing the closed conformation (PDB code 2M5610) and four started from the crystal structure showing the open conformation (PDB code 4JWS9). All trajectories in the 3cam set started from the open conformation of P450cam (PDB code 4JX19), with one camphor molecule positioned above the substrate entry channel and two other camphor molecules at a distance of ~10 Å from the protein. In the simulations of the 3cam set, it was shown that a camphor molecule first binds to the allosteric site, priming channel 2 to open, followed by another camphor molecule binding to the active site, which widened channel 2.
It is important to note that both the P450cam/Pdx set and the 3cam set are nonequilibrium simulations, and, therefore, not all structures sampled during the simulations will necessarily be sampled by the proteins in solution.
Structure-based clustering of the two sets (Supporting Information) resulted in a single cluster for each set. The P450cam/Pdx set is represented by a cluster with a radius of 3.5 Å in RMSD (i.e., all structures within 3.5 Å from the centroid), while the 3cam set is represented by a broader cluster, with a radius of 4.9 Å from the centroid. The centroids of the clusters of the two sets are 2.5 Å apart in RMSD terms; hence, the two sets overlap marginally. The pairwise RMSDs of the cluster centroids of the two sets (Figure S1) show that the two centroid structures differ most in the C, D, E, F, and G helices (residues 150–213) and parts of the I helix (residues 250–267), all of which occupy different conformations in the open and closed conformations. The centroid of the P450cam/Pdx set is similar (1.5 Å RMSD) to the open conformation of P450cam published by Tripathi et al. (PDB code 4JWS), whereas the conformation of 3cam set centroid is similar (2.0 Å RMSD) to the closed form of P450cam (PDB code 2CPP). The centroid of the 3cam set also had a camphor molecule bound to the proposed allosteric site.
Determination of the Δχ Tensor and PCS Prediction.
A Δχ tensor was determined for both sets of P450cam structures (P450cam/Pdx and 3cam). The frames of all trajectories in each simulation were rotated and translated to ensure that all G helices overlaid because CLaNP-7 is attached to residues 195 and 199 in helix G. Previously published experimental PCS,11 obtained in the absence of Pdx and presence of 1 mM camphor, for the E195C/A199C/C334A mutant of P450cam linked to CLaNP-7-(Yb3+), were used to determine the position of the paramagnetic center, and the size and orientation of the Δχ tensor, by simultaneously fitting a single set of tensor parameters using averaging over all structures of the ensemble. Despite the fact that these 161 PCS only account for 43% of the total amides in the protein, their locations are distributed across the whole protein (Figure S2). On the basis of the magnitudes of Δχ tensor components, the position of the lanthanoid ion, and the Qa scores of the fits (Figure 4), we concluded that the P450cam/Pdx set is incompatible with the observed PCS. On the other hand, we found that the 3cam set is compatible with the observed PCS and the PCS predicted for the 3cam set were analyzed further.
Figure 4.
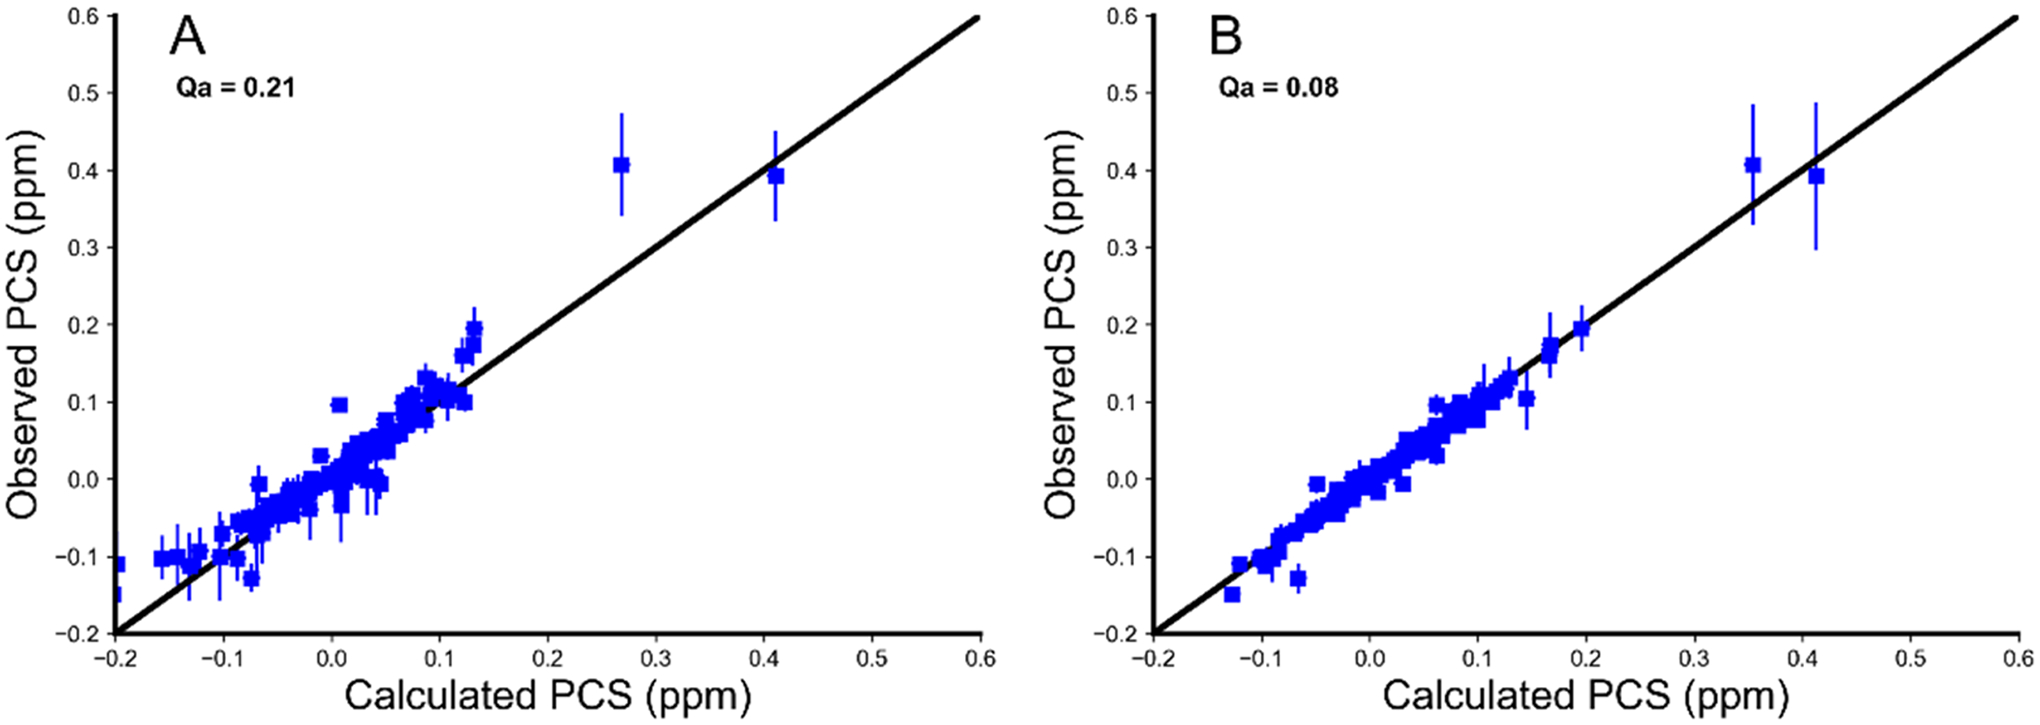
Calculated vs observed PCS for the P450cam/Pdx set (A) and the 3cam set (B). Observed PCS are the 161 HN PCS measured for 195C/A199C/C334A mutant of P450cam linked to CLaNP-7-(Yb3+) in the presence of 1 mM camphor and in the absence of Pdx. Calculated PCS are ensemble-averaged values calculated using Paramagpy.22 The errors in the observed PCSs were estimated to be ±0.008 ppm and the errors in the calculated PCS are the standard deviations of the predicted PCSs determined from all simulation frames.
Analysis of Predicted PCS for the 3cam Set.
The modality of the PCS for each amino acid was analyzed using the diptest R package. For 14 residues, the distribution of their PCS across the whole data set was multimodal (Figure S4). Model-based clustering analysis indicated that four clusters could be identified based on the value of the PCS of the set of 14 relevant residues (see the Supporting Information).
The 14 residues with multimodal PCSs are indicated in Figure 5 and listed in Table 1. Substrate-dependent conformational changes for all residues except A12 and N30 have been reported by Pochapsky and co-workers,8,29 and these have been attributed to transitioning from the open to the closed state; E171 is also located in the proposed allosteric binding site.
Figure 5.
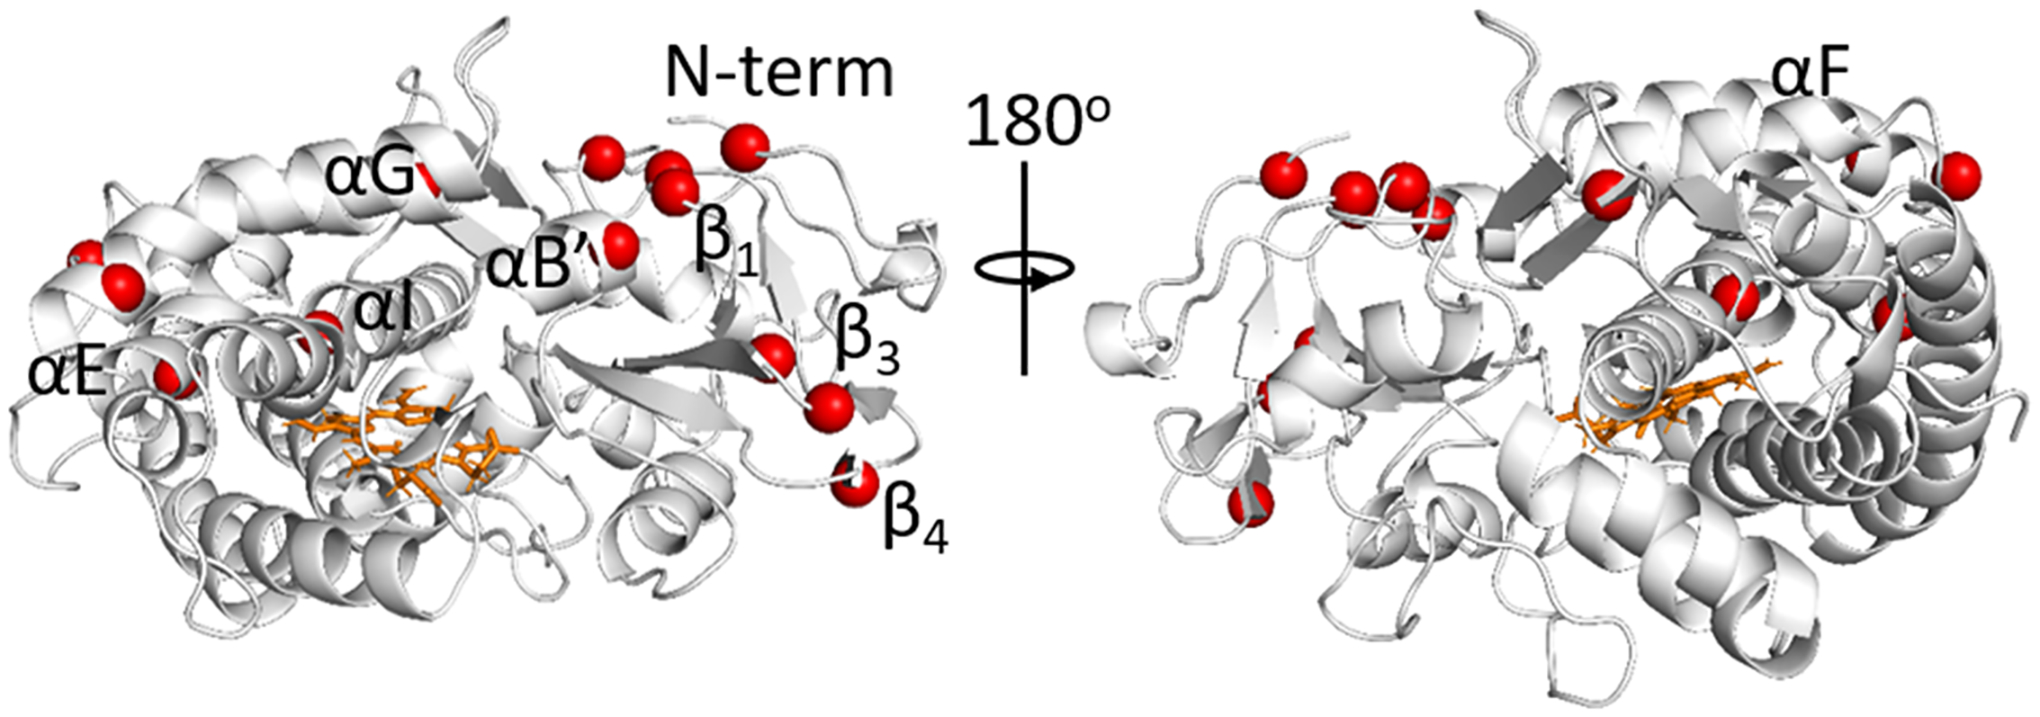
Closed structure of P450cam (PDB code 3L637) showing the 14 residues identified as having multimodal PCS distributions in the 3cam set. The backbone of the protein is shown in light gray ribbons, the heme is shown in orange sticks, and the N atoms of the residues are shown as red spheres.
Table 1.
Fourteen Residues with Multimodal PCS Distributions in the 3cam Set and Their Locations in P450cam
| location in P450cam | residues |
|---|---|
| N terminus | A12, N30 |
| β1 sheet | N59, G60 |
| B′ helix | E91 |
| E helix | F163 |
| F helix | E171 |
| G-helix | E209 |
| I helix | L250 |
| β3 sheet | K314, D316, Q317 |
| β4 sheet | E306 |
| C-terminus | Q400 |
Ensemble-averaged Δχ tensors were calculated for each cluster. Calculated Qa scores for both the full data set and for the 14 residues alone (Figures 6 and S5) showed that clusters 2 and 3 reproduced the experimental data best, with Qa scores of 0.07 for both the full data set and the subset of residues, compared to ~0.10 for clusters 1 and 4 (Figure 7). The Qa scores calculated for clusters 1 and 4 using the subset of 14 residues were greater than those for the full data set (Figure S5), further demonstrating that clusters 2 and 3 show improved agreement with the experimental data. In addition, the axial and rhombic magnitudes of Δχ tensors (Table S1), along with the distributions of distances between the lanthanoid and the attachment site Cα atoms (Figure S6), demonstrated that the Δχ tensors of clusters 2 and 3 are in line with what has been previously observed for CLaNP-7-(Yb3+), whereas the tensor magnitudes of clusters 1 and 4 are in excess of what has previously been observed. Additionally, the distance distributions of clusters 1 and 4 showed the lanthanoid was positioned too far away from the attachment site to be sterically possible (Figure S6, SI text).
Figure 6.
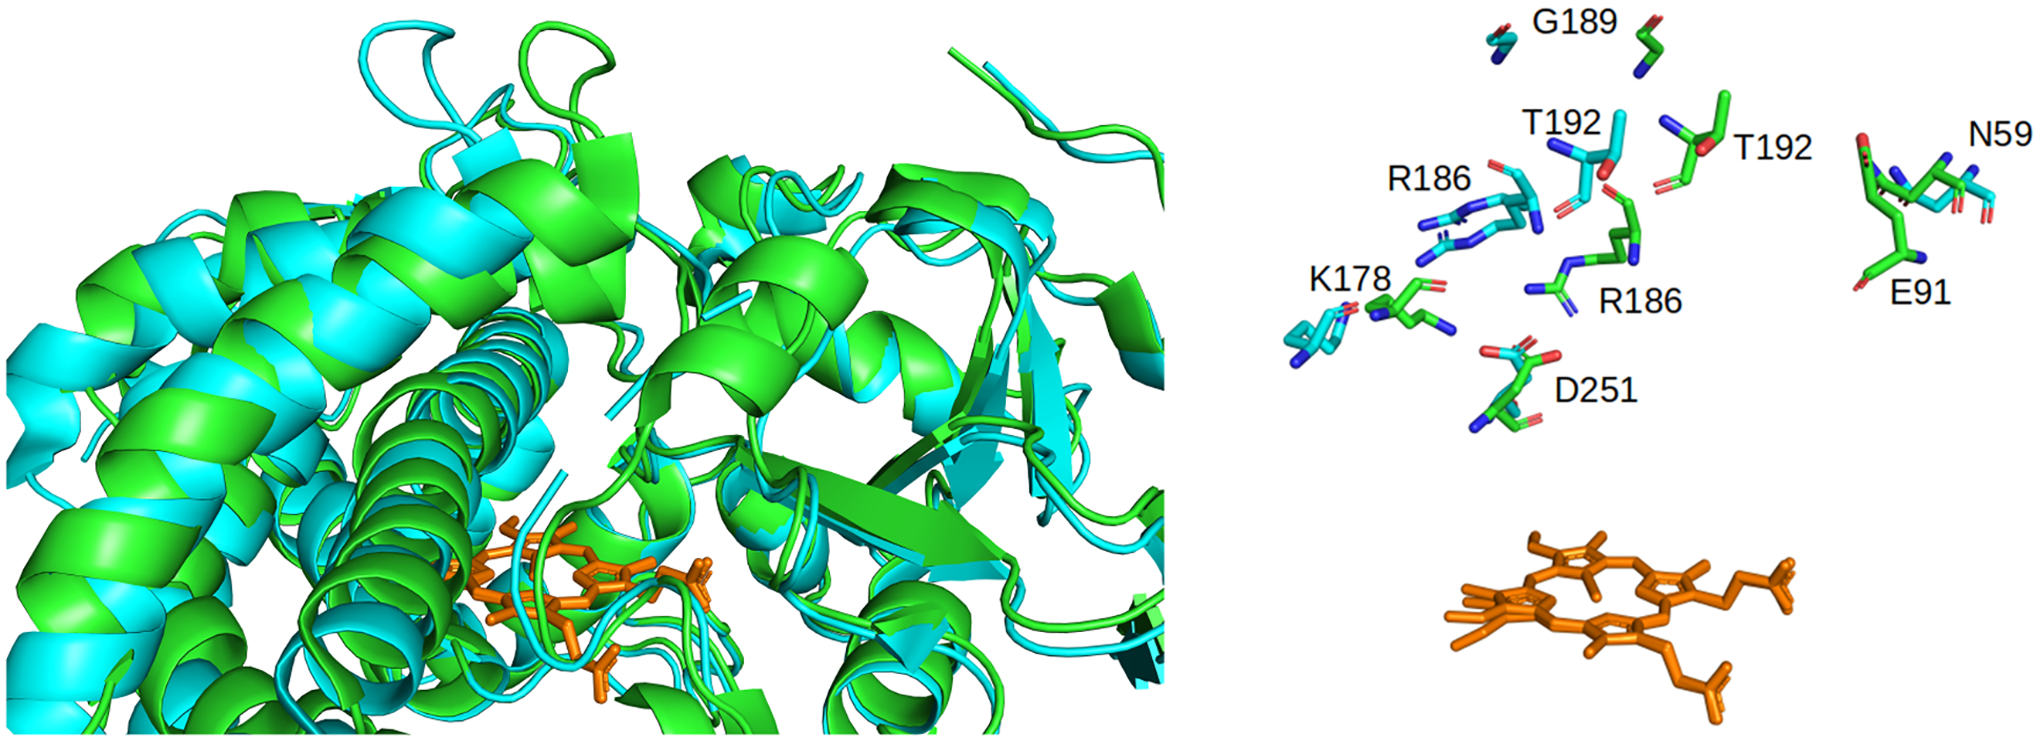
Overlay of the open (cyan) and closed (green) states of P450cam (PDB codes 3L61 and 3L63,7 respectively), shown in the cartoon form (left) with the position key residues whose positions and orientations differ between the two states shown as sticks (right). The heme is shown as orange sticks.
Figure 7.
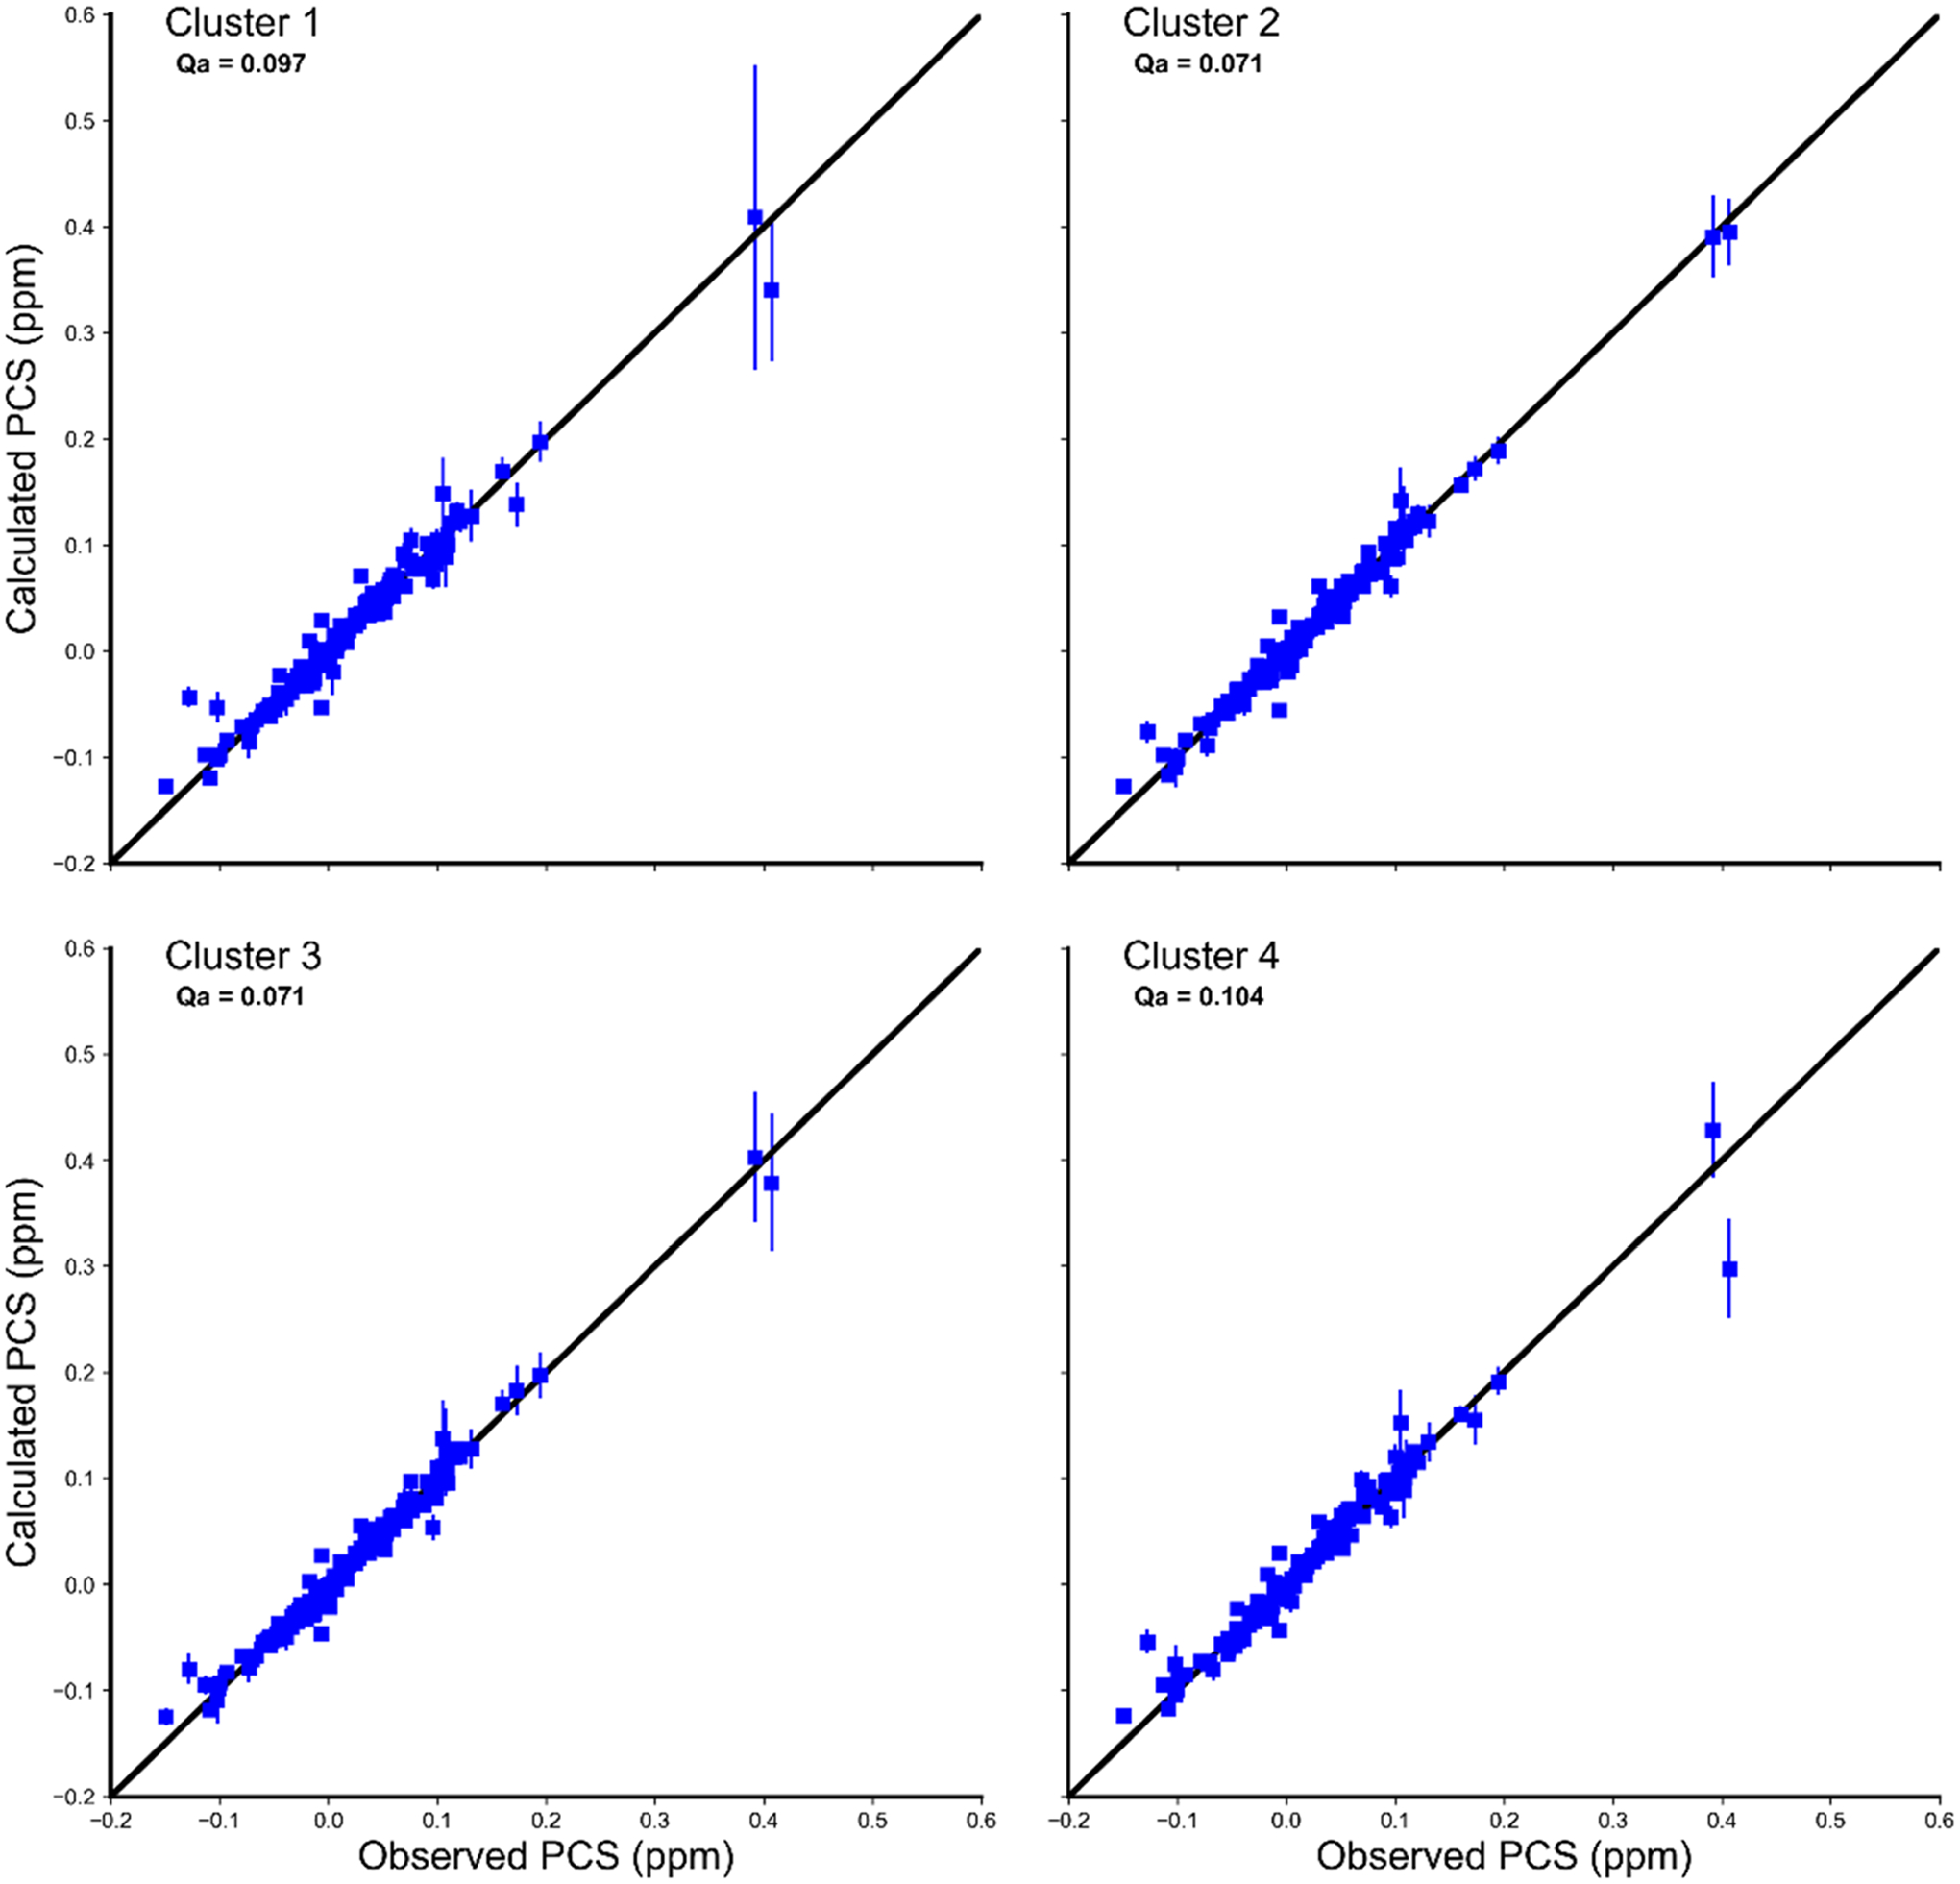
Calculated vs observed PCS for the four clusters of the 3cam set. The errors in the observed PCSs were estimated to be ±0.008 ppm and the errors in the calculated PCS are the standard deviations of the predicted PCS determined from all simulation frames.
The positions of N59, E91, T192, K178, R186, G189, and D251 centroid (structure with the lowest RMSD to mean) of each cluster are shown in Figure 8. The distances between these key residues were used to compare the clusters with the known open and closed structures of P450cam (Table 2, Figure 6). The E91Cα–T192Cα distributions (Figure S7) show that, for cluster 3, there are two distinct distances of 8.7 and 10.0 Å, and for cluster 2, a single peak at 8.4 Å is present, all of which are close to the 9.4 Å distance observed for the closed conformation (Table 1). Conversely, the most probable distances for clusters 1 and 4 of 14.4 and 17.4 Å, respectively, are both larger than the distance (13.2 Å) in the X-ray crystal structures of the open conformation.7,9 These results demonstrate that the positions of the B′, F, and G helices are those of the closed state in clusters 2 and 3, and those of the open state in clusters 1 and 4. The N59Cα–G189Cα distance distributions (Figure S7) show that the most frequent distances for clusters 1 and 4 are 26 and 20 Å, respectively, which provides further evidence that these clusters represent an open conformation of P450cam (Table 1). The same distance for cluster 2 is 13 Å on average, in line with the expected value for the closed conformation of P450cam. For cluster 3, the average N59Cα–G189Cα distance is 15.8 Å, i.e., there is the partial opening of the substrate entry channel; the partial opening of the entry channel is also supported by the peak at 10 Å in the E91Cα–T192Cα distance distribution.
Figure 8.
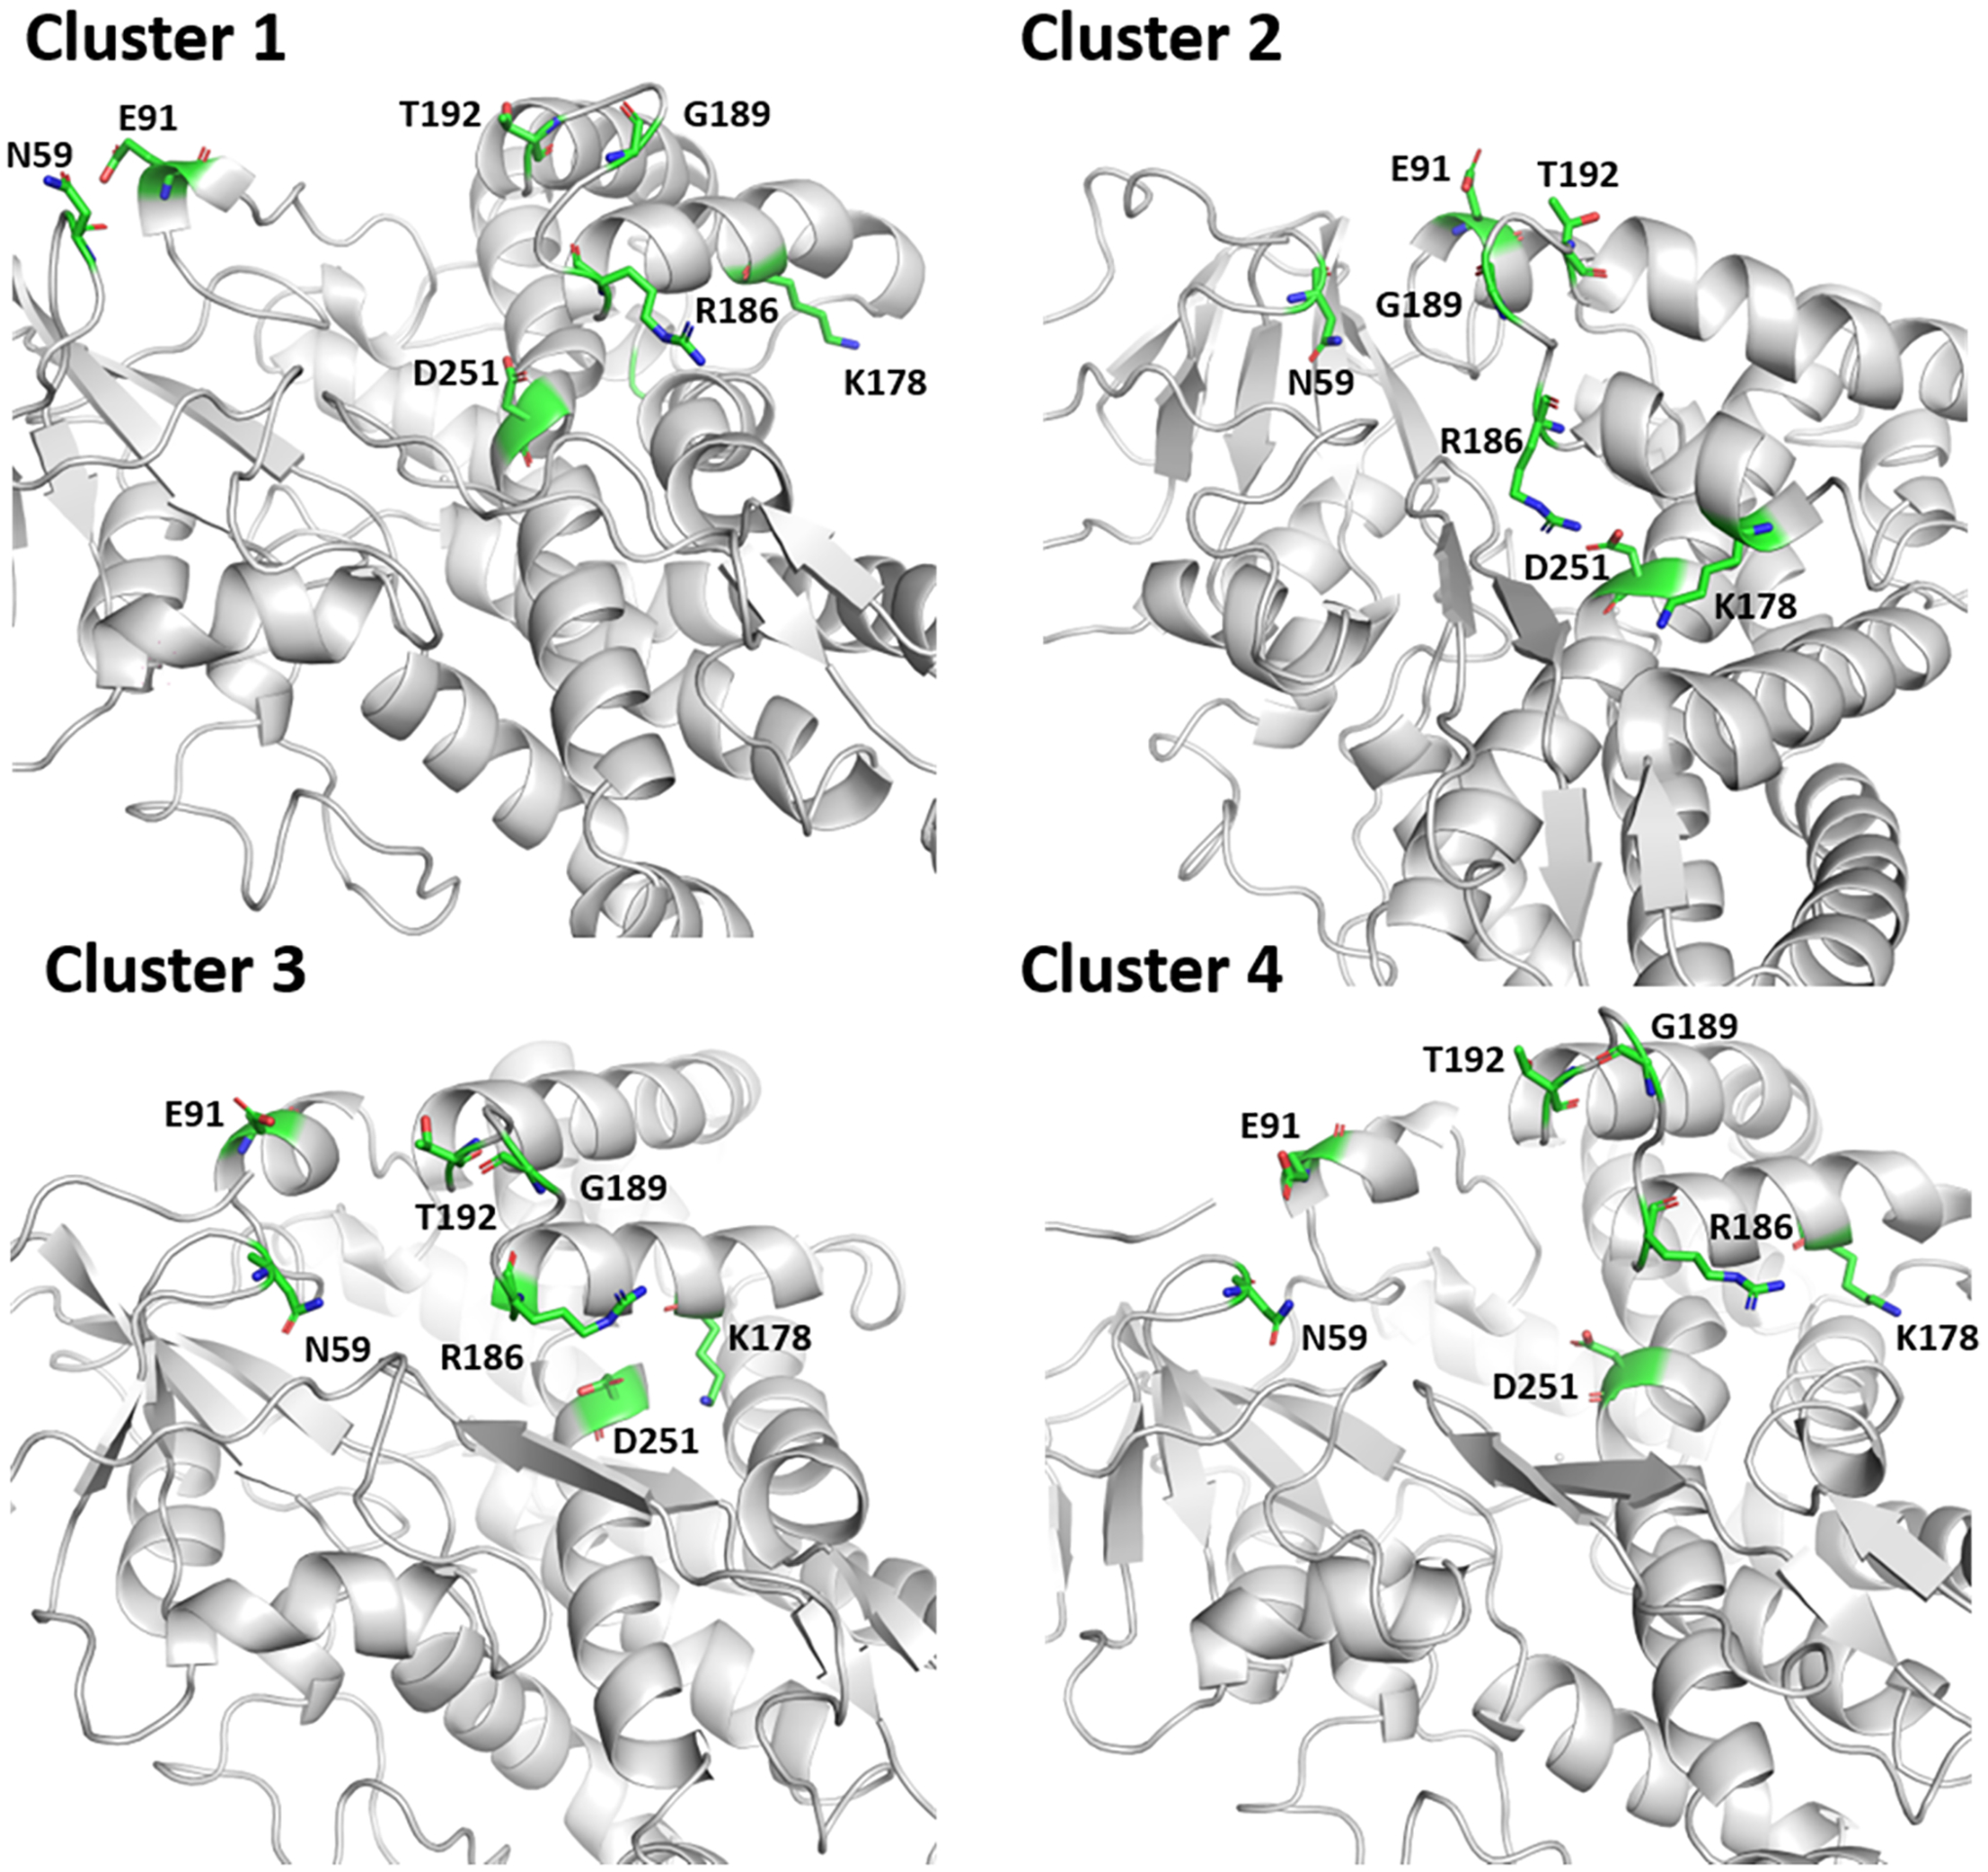
Positions of N59, E91, T192, K178, R186, G189, and D251 in structures of the centroids of each cluster. The protein backbone is shown in gray and the residues are shown as green sticks.
Table 2.
Distances between Key Residue Pairs Used to Distinguish between the Open and Closed States of P450cama
| distance in closed state (Å) | distance in open state (Å) | |
|---|---|---|
| N59Cα–G189Cα | 13.8 | 22.3 |
| E91Cα–T192Cα | 9.4 | 13.2 |
| R186Hη1–D251Oδ1 | 3.3 | 6.5 |
| R186Hη2–D251Oδ2 | 3.5 | 4.8 |
| K178Nζ–D251Oδ2 | 4.8 | 6.4 |
Distances for both states refer to structures published by Goodin and co-workers7 (PDB codes 3L61 (open) and 3L63 (closed)).
The distance distributions for R186Hη1–D251Oδ1, R186Hη2–D251Oδ2, and K178Nζ–D251Oδ2 (Figure S8) show that in clusters 1, 3, and 4; the salt bridges between R186 and D251 are absent; however, in cluster 2, these salt bridges are intact (Figure S8). Conversely, the salt bridge between K178 and D251 is present in the majority of structures in cluster 3, but absent in clusters 1, 2, and 4. This demonstrates a dynamic interplay between these salt bridges when P450cam is in the closed conformation (clusters 2 and 3), whereby the presence of R186–D251 bridge results in the breakage of the K178–D251 bridge and vice versa.
In structures of all four clusters’ centroids, the N-Cα-Cβ-Cγ (χ1) dihedral angle of L358 was ~−70°, characteristic of the closed conformation of P450cam, and observed in the P450cam/Pdx complex (PDB code 3W9C10). However, cluster 1 has approximately equal populations of dihedral angles of around −70 and 65°, the latter of which has been observed in crystal structures of the P450cam/Pdx complex, solved by Poulos and co-workers (PDB codes 4JX1 and 4JWU9).
The dihedral angle distribution of L358 N-Cα-Cβ-Cγ (Figure 9) shows two modes for clusters 2–4, namely, gauche+ (~−70°), and trans (~−180°). The gauche+ conformation characteristic of the closed conformation of P450cam and observed in the P450cam/Pdx complex (PDB code 3W9C10). Cluster 1 also has two conformations, namely trans and gauche− (~65°), the latter of which has been observed in the crystal structures of the P450cam/Pdx complex, solved by Poulos and co-workers (PDB codes 4JX1 and 4JWU9).
Figure 9.
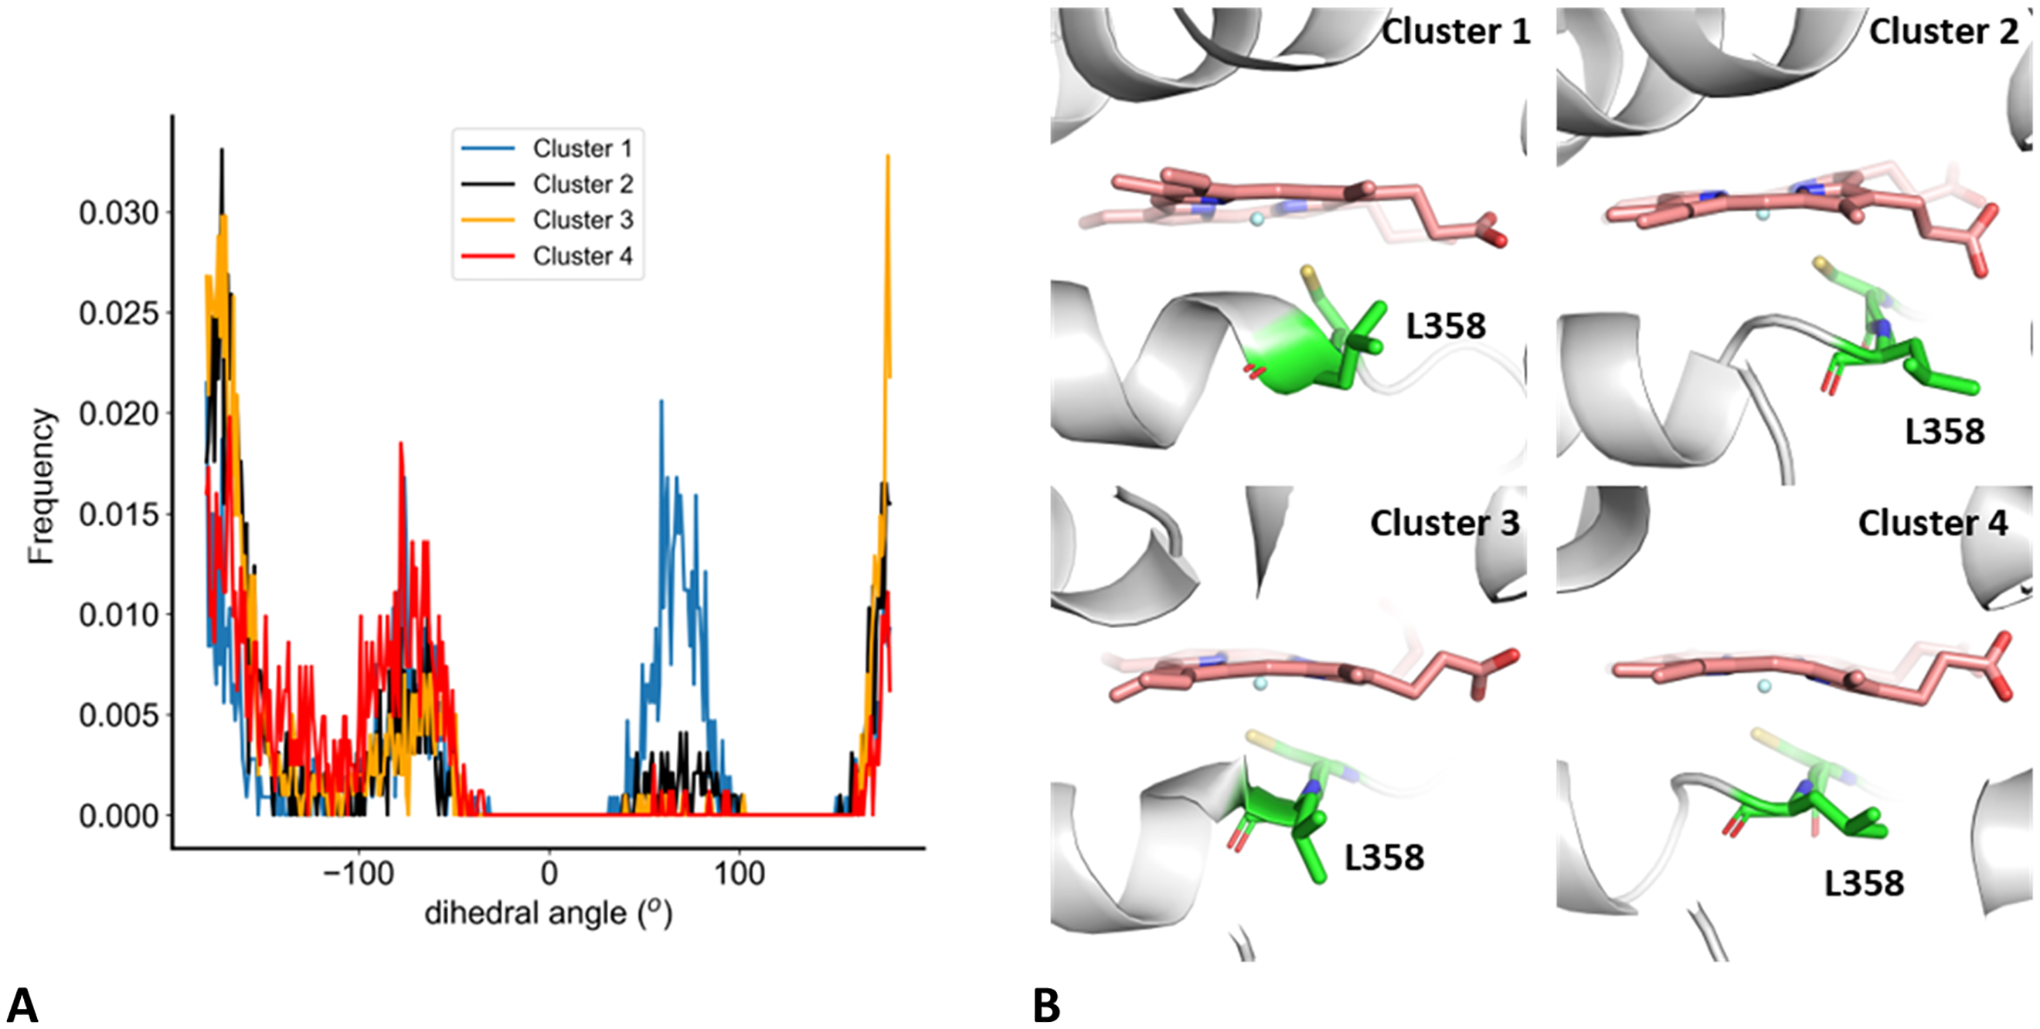
Orientation of L358. (A) L358 N-Cα-Cβ-Cγ dihedral angle distributions for the four clusters of the 3cam set. (B) Conformation of L358 in the centroid structures of each cluster. The heme is shown in pink sticks; C357 and L358 are shown as green sticks.
The centroids of each cluster were superposed on the substrate-free (PDB code 3L617) and substrate-bound (PDB code 2CPP30) structures of P450cam, revealing that the conformations adopted by β1, β3, and β4 strands in clusters 2 and 3 matched those in the substrate-bound structure and conformations of these structural elements in clusters 1 and 4 matched those present in the substrate-free structure. In addition, a camphor molecule is bound to the allosteric site in the centroid of cluster 3, but not in the centroids of clusters 1, 2, and 4.
Determination of the Binding Conformation for Pdx.
The average predicted PCS for each of the clusters were plotted against previously published Leu 1HN PCS for the Pdx bound state and Qa scores were calculated for each data set (Figure 10). These fits reveal that the PCS for L166 and L250, which previously could not be accurately reproduced using crystal structures, match with the PCSs predicted for all clusters. Cluster 3 gives the best match with the experimental Leuderived PCSs. Therefore, we conclude that cluster 3 best represents the conformation(s) to which Pdx binds in solution. In addition, the metal positions obtained for clusters 1 and 4 are physically unfeasible (see above, SI text, Figure S6).
Figure 10.
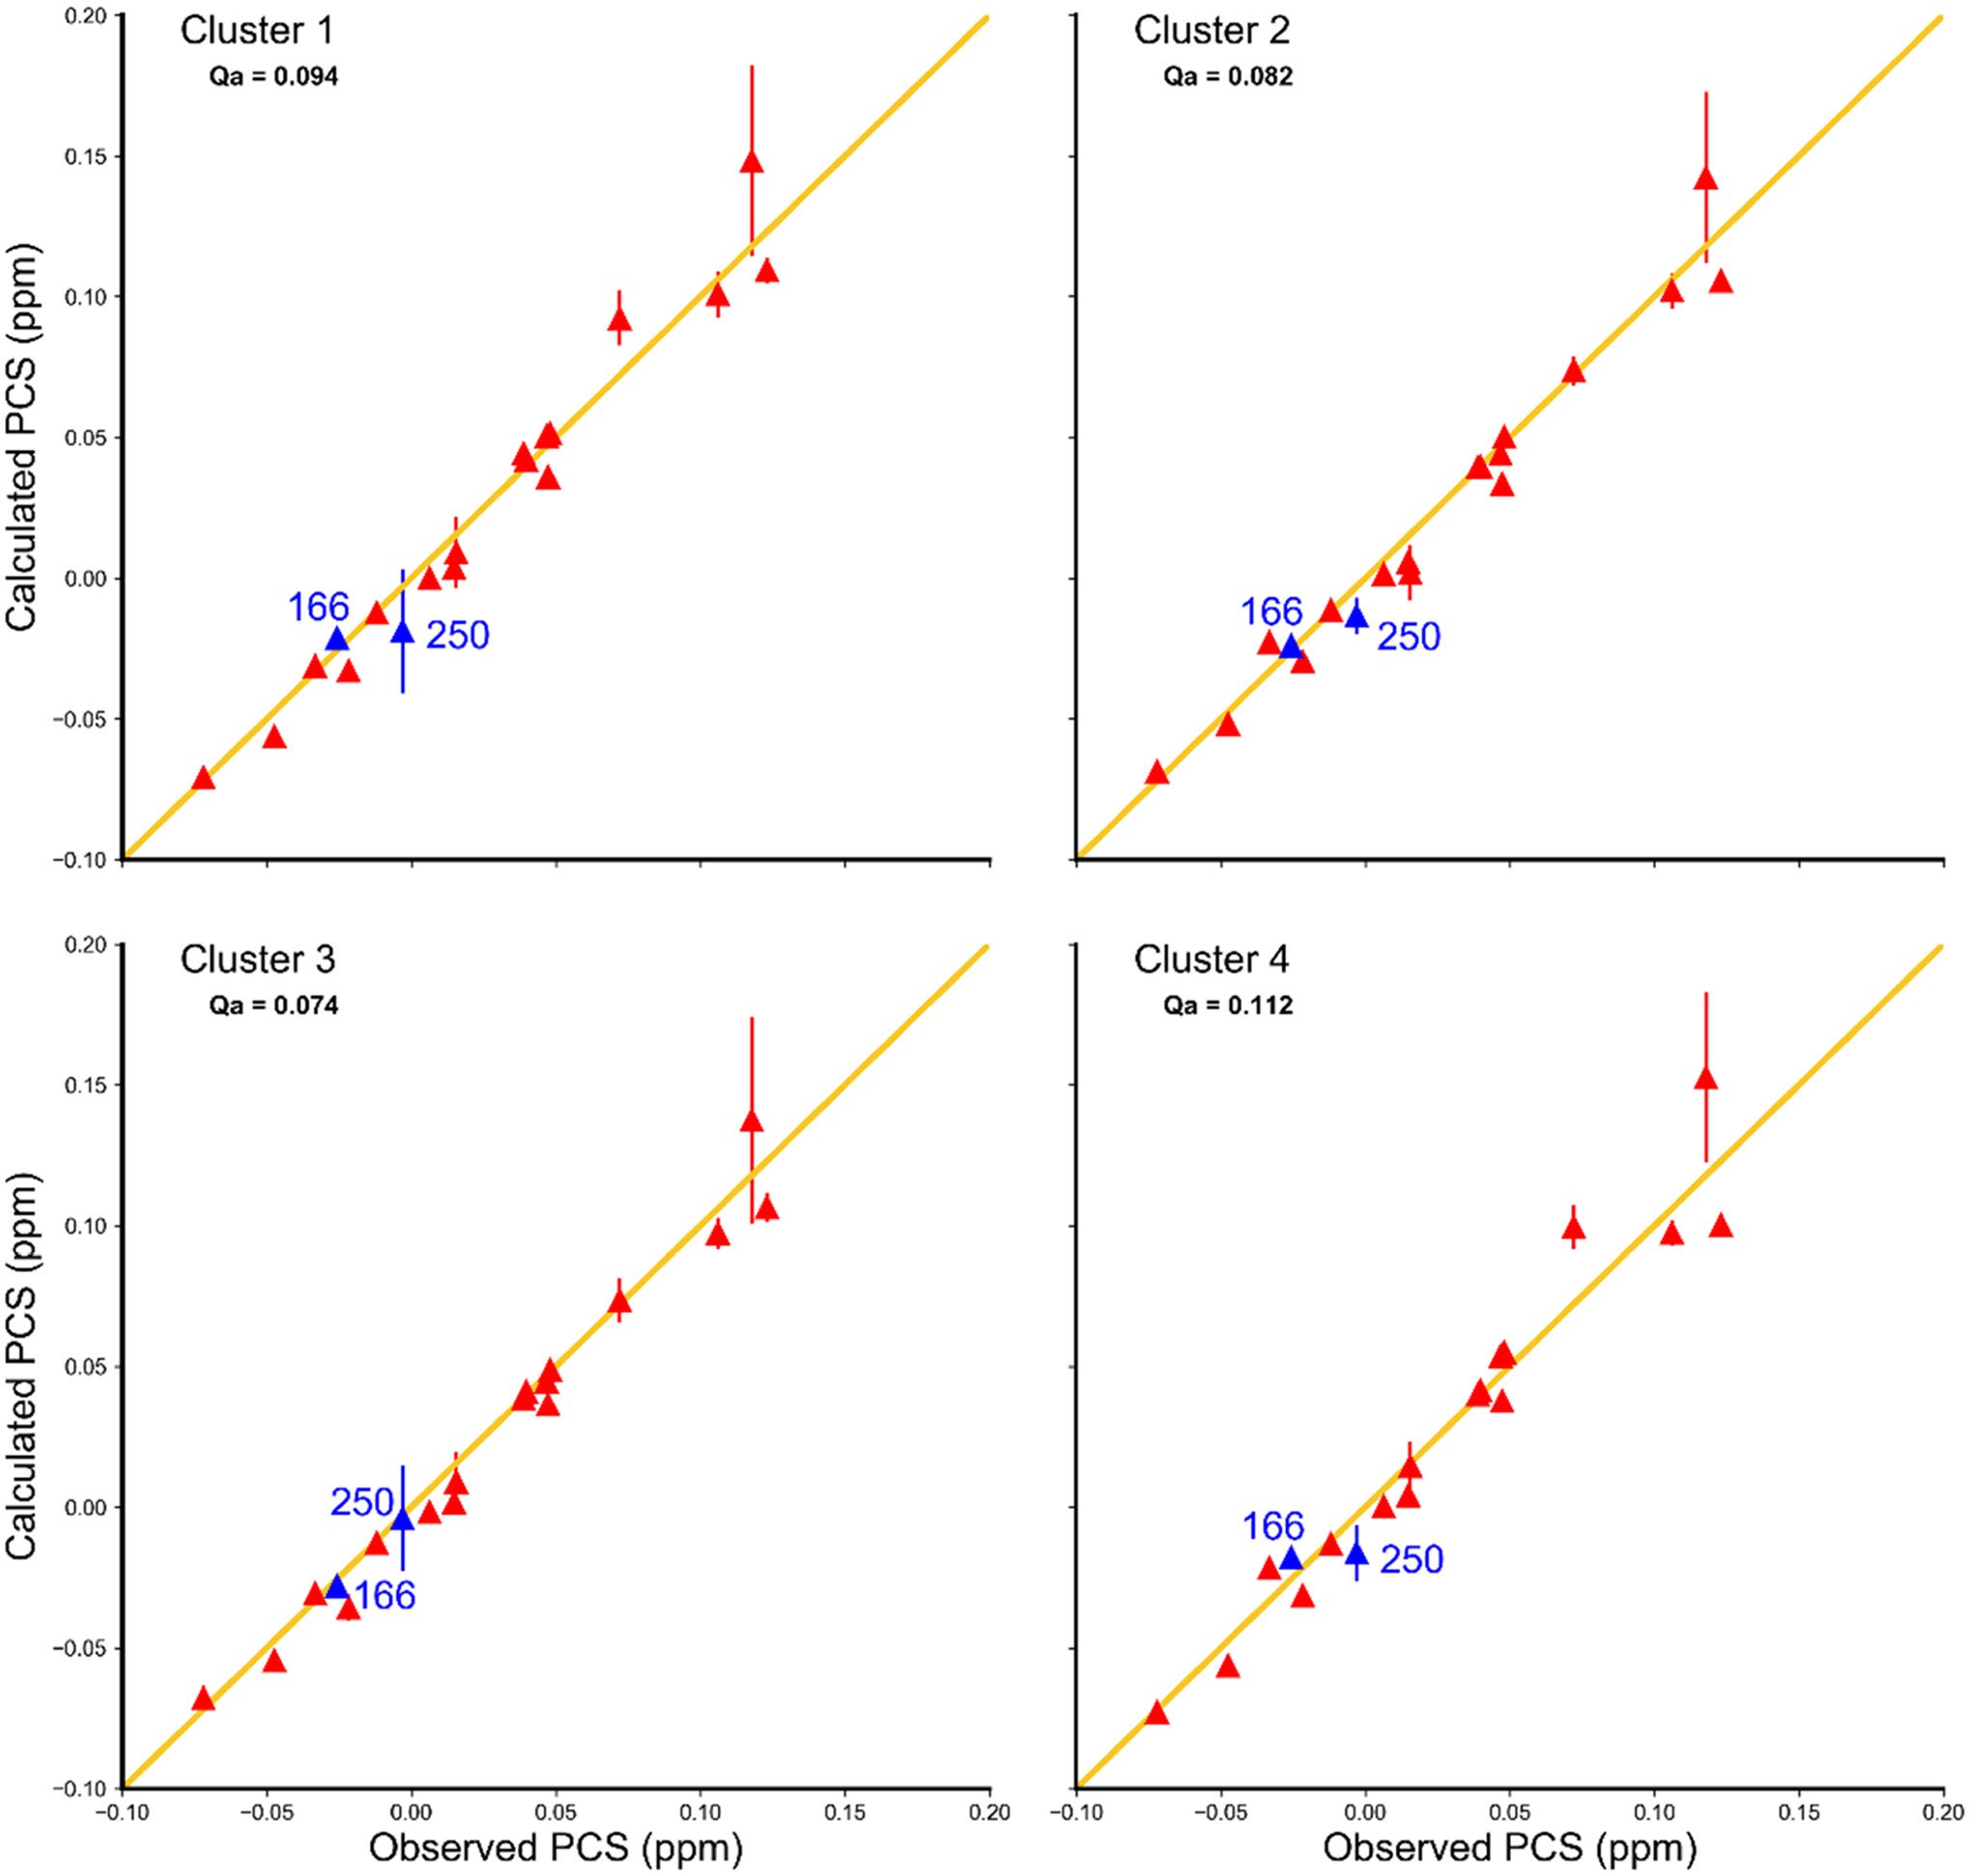
Average calculated PCS for the four clusters of the 3cam set against Leu 1HN PCS observed for P450cam in the presence of Pdx. The errors in the observed PCSs were estimated to be ±0.008 ppm, and the errors in the calculated PCS are the standard deviations of the predicted PCS determined from all simulation frames.
Occupancy of the Second Binding Site.
A potential allosteric binding site for camphor was observed at the base of F and G helices in the MD simulations of Follmer et al.14 and was hypothesized to cause the opening of a second channel, denoted channel 2, below this allosteric binding site. The presence of this channel was quantified by the distance between the Cα atoms of S83 and S102, which was shown to be 5 Å if the channel was closed, with this distance increasing to ~7 to 13 Å when the channel was open. The Qa scores in Figure 7 are identical for both clusters 2 and 3, and the Qa score of clusters 2 and 3 combined is 0.07; hence, the combination of these two clusters best reproduce the experimental PCS. In clusters 2 and 3, the probability channel 2 being open is ~0.6 (Figure 11A), which matches the combined percentage camphor occupancy of the allosteric site (Figure 11B). The current results show that the presence of the allosteric site and its correlation with the opening of channel 2 is compatible with the PCS.
Figure 11.
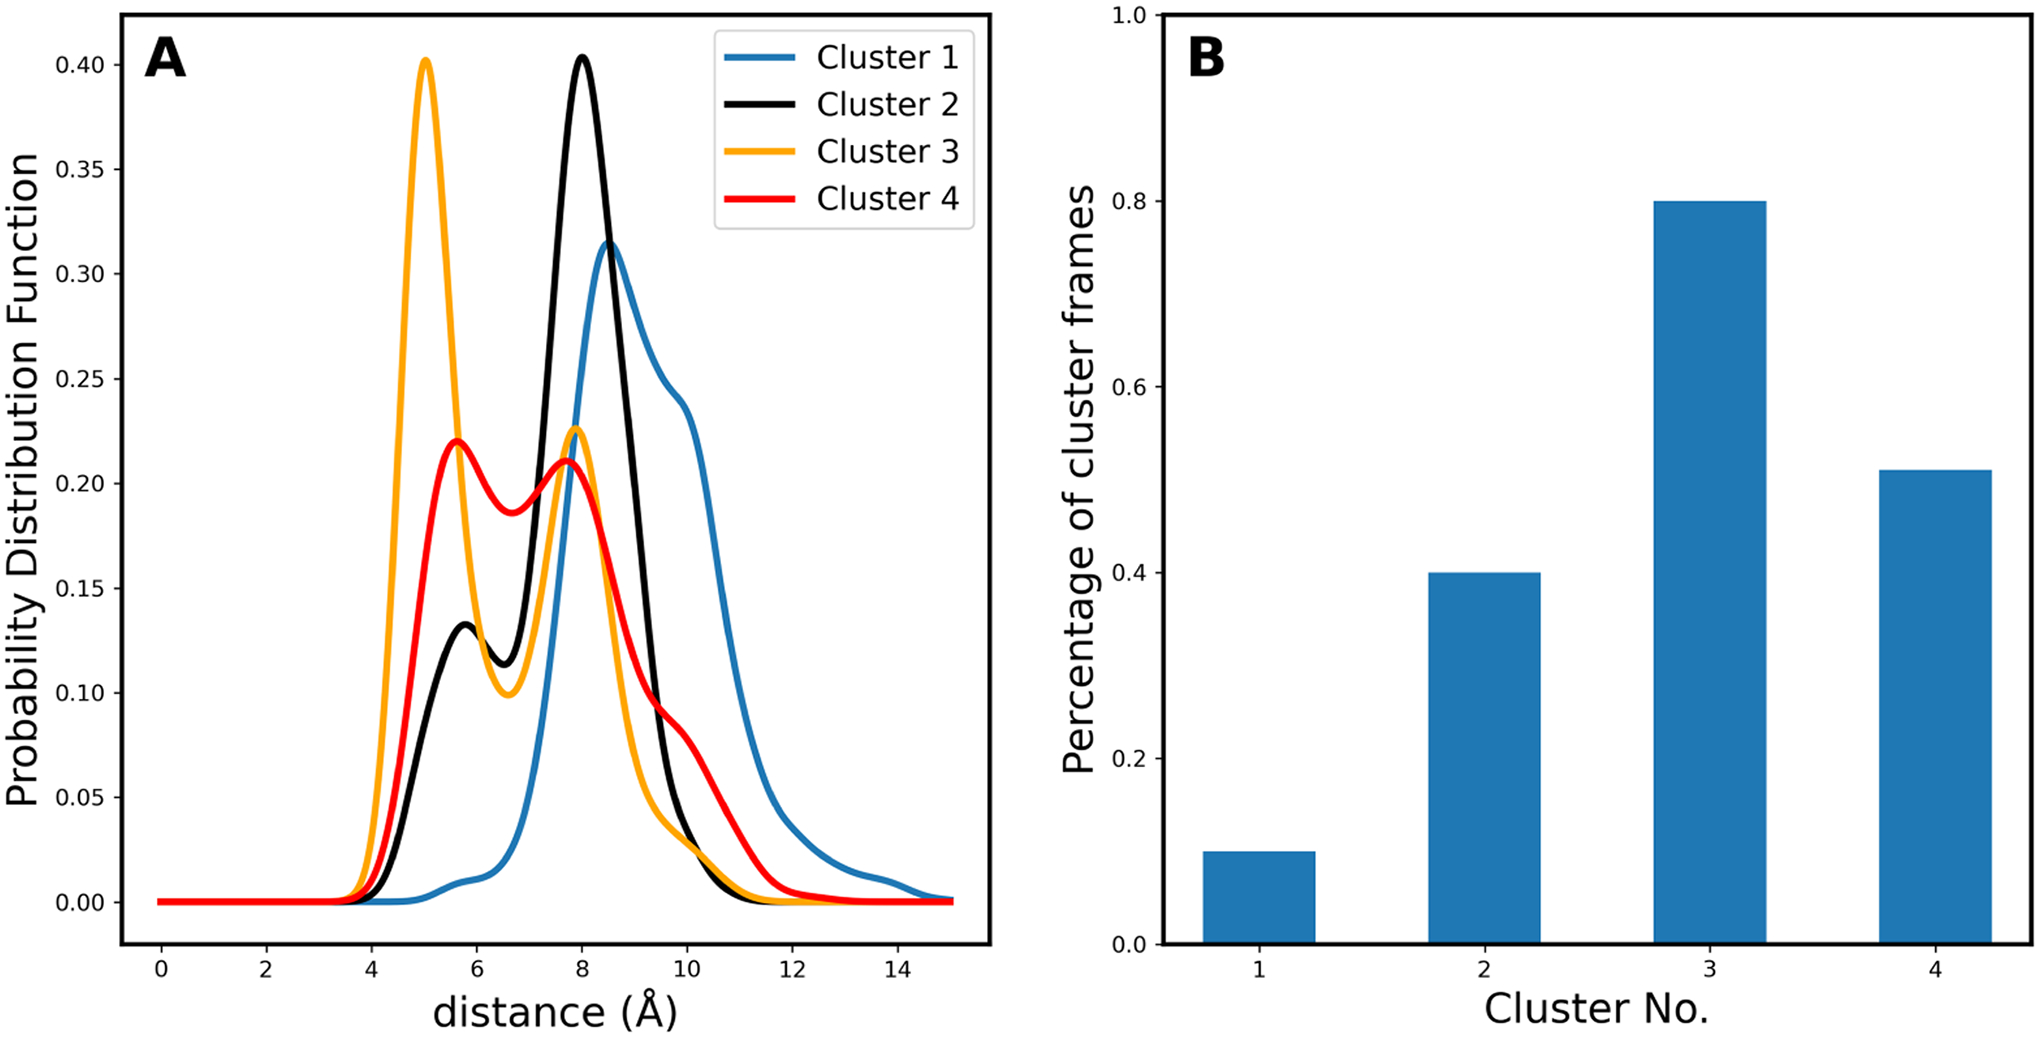
Occupancy of the allosteric binding site in the four clusters. (A) S83Cα–S102Cα distance distributions measured for the four clusters of the 3cam ensemble. (B) Camphor population of the allosteric binding pocket as a percentage of frames in each cluster.
DISCUSSION
In a previous paramagnetic NMR study of P450cam,11 the PCSs of a number of residues could not be reliably back-predicted; hence, they were designated as “mobile”; these residues are located in distinct regions of the P450cam structure. K126, L166, G168, T217, and A219 are located in a pocket below the base of the F/G helices, which Follmer et al.14 postulated to be an allosteric binding site for the substrate, camphor, and the 1H PCS of these residues provide experimental evidence in support of the presence of this site, as demonstrated by the excellent fit of these PCS to cluster 3 of the 3cam set (Figure 7). L169, E171, and E172 are located at the base of the F helix, I207 and E209 are located at the base of the G-helix, immediately above the proposed allosteric pocket, and A238, K239, and M241 are located at the beginning of the I helix. All of these regions occupy different conformations when compared to the closed structure of P450cam. L250, which was a significant outlier from the P450cam/Pdx Leu 1HN PCS, and therefore previously excluded from Qa factor calculation, is accurately back-predicted using the 3cam set, and its mobility is demonstrated by the spread of calculated PCS (given by the vertical error bar in Figure 7). Moreover, L250 has been identified29 as mechanically coupled to I160, and this mechanical coupling has been reported to allow deformation of the I helix upon substrate binding, both by NMR29 and MD14 and the present PCS analysis provides further support to this hypothesis.
Previously, the only structural evidence for camphor binding to this site was an observation of a peak of electron density at 7σ in a crystal structure of the open state of P450cam obtained after soaking the crystals in camphor.6 This peak was argued to be consistent with a weakly bound camphor molecule, but the electron density was not sufficient to resolve this camphor molecule.14 Early spectroscopic studies33,34 demonstrated a shift high-spin to low-spin state shift at high camphor concentration, which was attributed to a second binding site, and more recent NMR and docking studies35 showed that a second camphor binding site could exist in the region identified by MD simulations.14
Analysis of the different clusters identified in the 3cam ensemble provides support for different hypotheses concerning the behavior of P450cam in solution and the state to which Pdx binds. Our analysis shows that the ensemble of structures that provides the best agreement with PCS observed in the presence of Pdx has a combination of features of the open and closed conformations of P450cam (Figure 2D). Even though a good fit of PCS was obtained using all members of the 3cam set, the better fits obtained for subsets (cluster 2 and 3, Figure 7) demonstrate that simulations are not fully converged, but relevant states, which reproduce experimentally measured PCS, are sampled along the trajectories.
The distance distribution observed for E91Cα–T192Cα and N59Cα–G189Cα showed that the B′, F, and G helices are in the closed conformation, but that the substrate entry channel is not completely closed. Moreover, it has been previously shown in MD simulations that the N59Cα–G189Cα distance can transition from the open state to the closed state,31 providing further support to the notion that Pdx causes partial opening of the P450cam substrate entry channel but does not cause this channel to open fully.
The distance distributions for the salt bridge between R186 and D251 show that this bridge is broken for the most part in this cluster, with only ~20% of the frames showing intact salt bridges. This supports the hypothesis of Tripathi et al.9 that a water-mediated proton relay network forms when Pdx binds, but contrary to this hypothesis, it shows that the R186–D251 salt bridge is only destabilized, not completely broken. Indeed, a comparison of the salt bridge distances per frame demonstrates that there is a dynamic exchange between the two bridges (Figure S9) so that the proton relay network can be formed while keeping the substrate entry channel closed, but allowing channel 2 to open (Figures 1D and S4). In addition, the L358 N-Cα-Cβ-Cγ dihedral angle distribution shows that the position of this residue in the crystal structure of Hiruma et al.10 is consistent with the experimental PCS, whereas that of Tripathi et al.9 is not.
On the basis of these findings, under steady-state conditions and high camphor concentration, we propose a mechanism for Pdx binding, whereby the binding of camphor to the allosteric site promotes destabilization of the R186–D251 salt bridge, and partial opening of the substrate entry channel. This results in a favorable binding conformation for Pdx; Pdx binding stabilizes this conformation to prevent the reformation of the R186–D251 salt bridge, which could imply that Pdx binds P450cam more tightly at high camphor concentrations. However, it has been shown by ITC that Pdx binds more tightly to camphor-free P450cam13 (, ), which would appear to contradict this model although the relevance of camphor-free P450cam is questionable under turnover conditions where the camphor concentration is high. We argue that tighter binding of Pdx to P450cam in the second electron transfer step would be counterproductive, since a faster koff (higher KD) would facilitate more rapid electron transfer. The ensemble shows that when this channel is open, the R186–D251 salt bridge is broken, but the K178–D251 bridge is intact; therefore, we argue that both are required in order for channel 2 to open, and that the R186–D251 salt bridge is destabilized by allosteric camphor and Pdx binding, since it is required for proton relay. Consequently, the effector role of Pdx is to stabilize a conformation that allows entry of water through a partially opened substrate entry channel, and after hydroxylation of the substrate allows channel 2 to open for the product to egress from the active site. The opening of channel 2 in the presence of Pdx has recently been demonstrated by X-ray crystallography,15 which provides further support to this mechanism. We hypothesize that at high camphor concentrations, where most steady-state assays are carried out, camphor occupies the allosteric site during the first and second electron transfer steps in order that Pdx can be used for both steps, and the conformation of P450cam does not change between these steps. Indeed, the CamR repressor that regulates the expression of P450cam, Pdx, and PdR is only released from the CamR regulatory DNA sequence at high camphor concentrations,32 which would be sufficient to occupy the second camphor binding site (KD = 43 ± 8 μM35). The fact that P450cam catalysis can occur at low-camphor concentrations demonstrates that occupation of the allosteric site is not an absolute requirement for catalysis and could indicate that Pdx binding and allosteric camphor binding are cooperative, whereby Pdx binding is more favorable when the allosteric site is occupied, but Pdx binding can occur, albeit less favorably when the allosteric site is unoccupied, with Pdx, itself driving the necessary conformational changes required for binding. This would therefore account for less efficient catalysis at lower camphor concentrations.
CONCLUSIONS
Since the publication of the first crystal structures of the P450cam/Pdx complex, conflicting hypotheses concerning the conformation to which Pdx binds have been proposed. Partial evidence has been obtained that Pdx binds the open P450cam conformation, an intermediate state that closely resembles the closed conformation, or both open and closed states. The results of our PCS analysis show that Pdx binds to a state of P450cam, where the substrate entry channel is partially open (ajar), the active site residues are positioned to facilitate the formation of a water-mediated proton relay network akin to those observed for the open state, and that the formation of this conformation is driven by binding of an allosteric camphor molecule prior to the first electron transfer step. On binding of the allosteric camphor, the R186–D251 salt bridge is destabilized and breaks, allowing partial opening of the substrate entry channel and forming a conformation that is favorable to Pdx binding. Pdx stabilizes this conformation during both electron transfer steps and keeps the R186–D251 bridge broken so that a water-mediated proton relay network can form. Following the second electron transfer step, Pdx remains in complex with P450cam and helps to promote the opening of channel 2 as demonstrated by the recent structure of P450cam/Pdx complex with cyanide bound to the active site of P450cam.
Supplementary Material
Footnotes
Supporting Information
The Supporting Information is available free of charge at https://pubs.acs.org/doi/10.1021/acs.biochem.1c00406.
Supporting information contains a methods section with details on structure-based clustering and a result section with one table and nine figures (PDF)
Complete contact information is available at: https://pubs.acs.org/10.1021/acs.biochem.1c00406
The authors declare no competing financial interest.
Contributor Information
Simon P. Skinner, School of Molecular and Cell Biology and Astbury Centre, University of Leeds, Leeds LS2 9JT, U.K.
Alec H. Follmer, Department of Chemistry, University of California, Irvine, California 92697-3900, United States
Marcellus Ubbink, Leiden University, Institute of Chemistry, 2333 CC Leiden, The Netherlands.
Thomas L. Poulos, Department of Chemistry, University of California, Irvine, California 92697-3900, United States; Department of Molecular Biology and Biochemistry and Department of Pharmaceutical Sciences, University of California, Irvine, California 92697-3900, United States.
Jeanine J. Houwing-Duistermaat, School of Mathematics, University of Leeds, Leeds LS2 9JT, U.K.
Emanuele Paci, School of Molecular and Cell Biology and Astbury Centre, University of Leeds, Leeds LS2 9JT, U.K..
REFERENCES
- (1).Poulos TL Heme Enzyme Structure Function. Chem. Rev 2014, 114, 3919–3962. [DOI] [PMC free article] [PubMed] [Google Scholar]
- (2).Haniu M; Armes LG; Tanaka M; Yasunobu KT; Shastry BS; Wagner GC; Gunsalus IC The primary structure of the monoxygenase cytochrome P450cam. Biochem. Biophys. Res. Commun 1982, 105, 889–894. [DOI] [PubMed] [Google Scholar]
- (3).Gunsalus IC; Wagner GC Bacterial P-450cam methylene monooxygenase components: Cytochrome m, putidaredoxin, and putidaredoxin reductase. Methods Enzymol 1978, 52, 166–188. [DOI] [PubMed] [Google Scholar]
- (4).Poulos TL; Finzel BC; Gunsalus IC; Wagner GC; Kraut J The 2.6-A crystal structure of Pseudomonas putida cytochrome P-450. J. Biol. Chem 1985, 260, 16122–16130. [PubMed] [Google Scholar]
- (5).Kuznetsov VY; Poulos TL; Sevrioukova IF Putidaredoxin-to-Cytochrome P450cam Electron Transfer: Differences between the Two Reductive Steps Required for Catalysis. Biochemistry 2006, 45, 11934–11944. [DOI] [PMC free article] [PubMed] [Google Scholar]
- (6).Liou S-H; Mahomed M; Lee Y-T; Goodin DB Effector Roles of Putidaredoxin on Cytochrome P450cam Conformational States. J. Am. Chem. Soc 2016, 138, 10163–10172. [DOI] [PubMed] [Google Scholar]
- (7).Lee Y-T; Wilson RF; Rupniewski I; Goodin DB P450cam Visits an Open Conformation in the Absence of Substrate. Biochemistry 2010, 49, 3412–3419. [DOI] [PMC free article] [PubMed] [Google Scholar]
- (8).Asciutto EK; Pochapsky TC Some Surprising Implications of NMR-directed Simulations of Substrate Recognition and Binding by Cytochrome P450cam (CYP101A1). J. Mol. Biol 2018, 430, 1295–1310. [DOI] [PMC free article] [PubMed] [Google Scholar]
- (9).Tripathi S; Li H; Poulos TL Structural Basis for Effector Control and Redox Partner Recognition in Cytochrome P450. Science 2013, 340, 1227–1230. [DOI] [PubMed] [Google Scholar]
- (10).Hiruma Y; Hass MAS; Kikui Y; Liu W-M;Ölmez B; Skinner SP; Blok A; Kloosterman A; Koteishi H; Löhr F; Schwalbe H; Nojiri M; Ubbink M The Structure of the Cytochrome P450cam–Putidaredoxin Complex Determined by Paramagnetic NMR Spectroscopy and Crystallography. J. Mol. Biol 2013, 425, 4353–4365. [DOI] [PubMed] [Google Scholar]
- (11).Skinner SP; Liu W-M; Hiruma Y; Timmer M; Blok A; Hass MAS; Ubbink M Delicate conformational balance of the redox enzyme cytochrome P450cam. Proc. Natl. Acad. Sci. U.S.A 2015, 112, 9022–9027. [DOI] [PMC free article] [PubMed] [Google Scholar]
- (12).Myers WK; Lee Y-T; Britt RD; Goodin DB The Conformation of P450cam in Complex with Putidaredoxin Is Dependent on Oxidation State. J. Am. Chem. Soc 2013, 135, 11732–11735. [DOI] [PMC free article] [PubMed] [Google Scholar]
- (13).Hollingsworth SA; Batabyal D; Nguyen BD; Poulos TL Conformational selectivity in cytochrome P450 redox partner interactions. Proc. Natl. Acad. Sci. U.S.A 2016, 113, 8723–8728. [DOI] [PMC free article] [PubMed] [Google Scholar]
- (14).Follmer AH; Mahomed M; Goodin DB; Poulos TL Substrate-Dependent Allosteric Regulation in Cytochrome P450cam (CYP101A1). J. Am. Chem. Soc 2018, 140, 16222–16228. [DOI] [PubMed] [Google Scholar]
- (15).Follmer AH; Tripathi S; Poulos TL Ligand and Redox Partner Binding Generates a New Conformational State in Cytochrome P450cam (CYP101A1). J. Am. Chem. Soc 2019, 141, 2678–2683. [DOI] [PMC free article] [PubMed] [Google Scholar]
- (16).Bertini I; Luchinat C; Parigi G Magnetic susceptibility in paramagnetic NMR. Prog. Nucl. Magn. Reson. Spectrosc 2002, 40, 249–273. [Google Scholar]
- (17).Liu W-M; Keizers PHJ; Hass MAS; Blok A; Timmer M; Sarris AJC; Overhand M; Ubbink M A pH-Sensitive, Colorful, Lanthanide-Chelating Paramagnetic NMR Probe. J. Am. Chem. Soc 2012, 134, 17306–17313. [DOI] [PubMed] [Google Scholar]
- (18).Roe DR; Cheatham TE PTRAJ and CPPTRAJ: Software for Processing and Analysis of Molecular Dynamics Trajectory Data. J. Chem. Theory Comput 2013, 9, 3084–3095. [DOI] [PubMed] [Google Scholar]
- (19).Hollingsworth SA; Poulos TL Molecular dynamics of the P450cam-Pdx complex reveals complex stability and novel interface contacts. Protein Sci 2015, 24, 49–57. [DOI] [PMC free article] [PubMed] [Google Scholar]
- (20).Case DA; Babin V; Berryman JT; Betz RM; Cai Q; Cerutti DS; Cheathem TE; Darden TA; Duke RE; Gohlke H; Goetz AW; Gusarov S; Homeyer N; Janowski P; Kaus J; Kolossváry I; Kovalenko A; Lee TS; LeGrand S; Luchko T; Luo R; Madej B; Merz KM; Paesini F; Roe DR; Roitberg A; Sagui C; Salomon-Ferrer R; Seabra G; Simmerling CL; Smith W; Swails J; Walker RC; Wang J; Wolf RM; Wu X; Kollman PA AMBER14; University of California: San Francisco, 2014. [Google Scholar]
- (21).Case DA; Betz RM; Cerutti DS; Cheathem TE; Darden TA; Duke RE; Giese TJ; Gohlke H; Goetz AW; Homeyer N; Izadi S; Janowski P; Kaus J; Kovalenko A; Lee TS; LeGrand S; Li P; Lin C; Luchko T; Luo R; Madej B; Mermelstein D; Merz KM; Monard H; Nguyen H; Omelyan I; Onufriev F; Roe DR; Roitberg A; Sagui C; Simmerling CL; Botello-Smith WM; Swails J; Walker RC; Wang J; Wolf RM; Wu X; Xiao L; Kollman PA AMBER16; University of California: San Francisco, 2016. [Google Scholar]
- (22).Orton HW; Huber T; Otting G Paramagpy: software for fitting magnetic susceptibility tensors using paramagnetic effects measured in NMR spectra. Magn. Reson 2020, 1, 1–12. [DOI] [PMC free article] [PubMed] [Google Scholar]
- (23).Fletcher R Practical Methods of Optimization; Wiley: Chi-chester, New York, 1987. [Google Scholar]
- (24).Bashir Q; Volkov AN; Ullmann GM; Ubbink M Visualization of the Encounter Ensemble of the Transient Electron Transfer Complex of Cytochrome c and Cytochrome c Peroxidase. J. Am. Chem. Soc 2010, 132, 241–247. [DOI] [PubMed] [Google Scholar]
- (25).Hartigan JA; Hartigan PM The Dip Test of Unimodality. Ann. Stat 1985, 13, 70–84. [Google Scholar]
- (26).Fraley C; Raftery AE Model-Based Clustering, Discriminant Analysis, and Density Estimation. J. Am. Stat. Assoc 2002, 97, 611–631. [Google Scholar]
- (27).Schwarz G Estimating the Dimension of a Model. Ann. Stat 1978, 6, 461–464. [Google Scholar]
- (28).Wit E; Heuvel E; van den Romeijn J-W ‘All Models are Wrong…’: An Introduction to Model Uncertainty. Stat. Neerl 2012, 66, 217–236. [Google Scholar]
- (29).Colthart AM; Tietz DR; Ni Y; Friedman JL; Dang M; Pochapsky TC Detection of substrate-dependent conformational changes in the P450 fold by nuclear magnetic resonance. Sci. Rep 2016, 6, No. 22035. [DOI] [PMC free article] [PubMed] [Google Scholar]
- (30).Poulos TL; Finzel BC; Howard AJ High-resolution crystal structure of cytochrome P450cam. J. Mol. Biol 1987, 195, 687–700. [DOI] [PubMed] [Google Scholar]
- (31).Batabyal D; Richards LS; Poulos TL Effect of Redox Partner Binding on Cytochrome P450 Conformational Dynamics. J. Am. Chem. Soc 2017, 139, 13193–13199. [DOI] [PMC free article] [PubMed] [Google Scholar]
- (32).Aramaki H; Kabata H; Takeda S; Itou H; Nakayama H; Shimamoto N Formation of repressor-inducer-operator ternary complex: negative cooperativity of d-camphor binding to CamR. Genes Cells 2011, 16, 1200–1207. [DOI] [PubMed] [Google Scholar]
- (33).Hui Bon Hoa G; Di Primo C; Dondaine I; Sligar SG; Gunsalus IC; Douzou P Conformational changes of cytochromes P-450cam and P-450lin induced by high pressure. Biochemistry 1989, 651–656. [DOI] [PubMed] [Google Scholar]
- (34).Lange R; Hui Bon Hoa G; Debey P; Gunsalus IC A thermodynamic-kinetic analysis of the cytochrome P-450 heme pocket. Acta Biol. Med. Ger 1979, 38, 143–152. [PubMed] [Google Scholar]
- (35).Yao H; McCullough CR; Costache AD; Pullela PK; Sem DS Structural evidence for a functionally relevant second camphor binding site in P450cam: Model for substrate entry into a P450 active site. Proteins 2007, 69, 125–138. [DOI] [PubMed] [Google Scholar]
Associated Data
This section collects any data citations, data availability statements, or supplementary materials included in this article.


