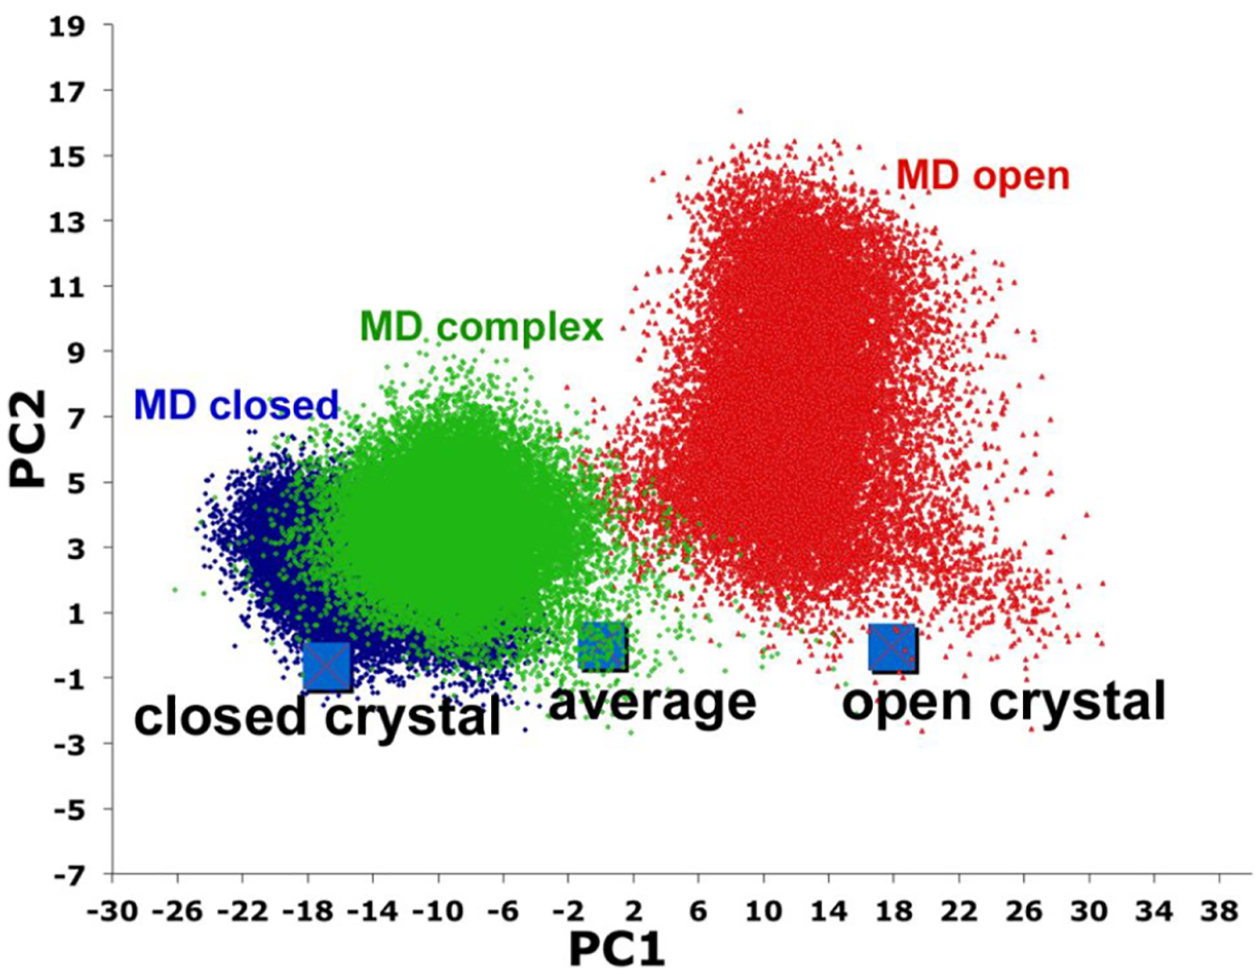
Figure 4.

Principal component analysis where each dot is a snapshot taken from ≈500 ns MD runs.2 A plot of the first two primary principal components, PC1 and PC2 (orthogonal to PC1), provides a simple representation on the majority of the correlated motion in going from the average structure to closed and open, where the average structure is midway between the open/close transition. The Cα atoms of each snapshot is a rms fit to the average structure and from the covariance matrix the first two major principal components (PC1 and PC2) that define the dominant correlated motions are computed. Since the average structure is rms fit to itself the average structure sits at PC1 = PC2 = 0 while the magnitude of PC1 and PC2 are identical for the open and closed structures but have opposite signs. The open structure is taken from the P450cam–Pdx complex crystal structure. Without Pdx bound (red) P450cam remains closer to the open state although there is considerable scatter due primarily to large motions in the F/G helical region. The closed MD run (blue) stays close to the closed state. With Pdx bound, the open state moves more toward the closed (green). In the various MD simulations reported both P450cam and Pdx were modeled in the oxidized states. Reproduced with permission from ref 2. Copyright 2017 American Chemical Society.
