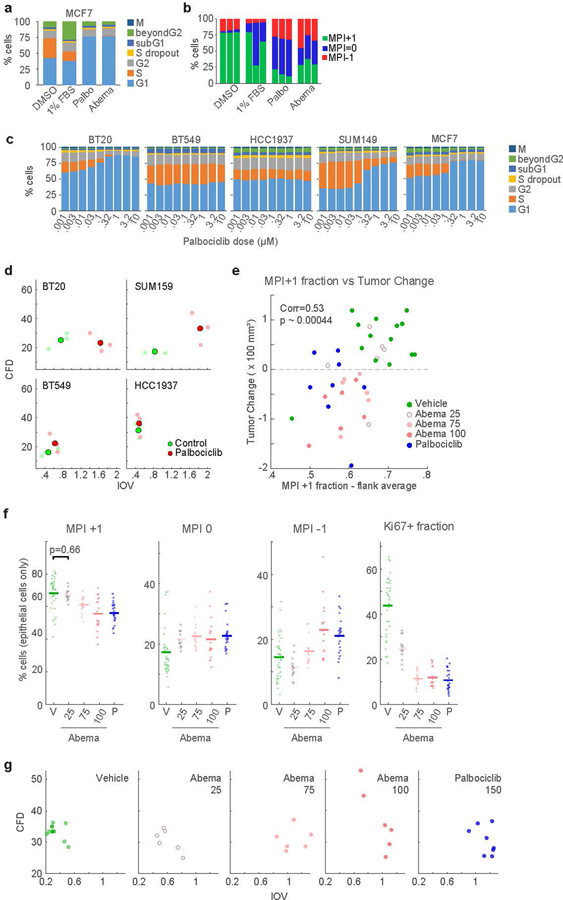
Extended Data Fig. 6: Orthogonal validation of changes in MPI and cell cycle coherence using cell cycle inhibition in vitro and in vivo.

a-b. Stacked bar graphs showing a. cell cycle fractions using the dye drop method76 and b. MPI frequencies by p-CyCIF for MCF-7 cells at baseline and in response indicated treatments for 24h c. Cell cycle fractions in five breast cancer cell lines showing differential response to treatment with increasing doses of Palbociclib dependent on the Rb status of the cell line. d. ccD-CMD plot from p-CyCIF from fixed untreated cells (Control), and cells exposed to 1 μM Palbociclib for 24h. Enlarged dot represents the average of 3 distinct biological replicates, n = 1000 cells each. e-g. t-CyCIF validation in MCF-7 xenografts in nude mice54. Doses are in mg/kg. e. Scatter plot of change in tumor size and MPI +1 fraction. Vehicle, n = 14 tumors from 7 mice. Abemaciclib, n = 6 tumors from 3 mice per dose. Palbociclib, n = 8 tumors from 5 mice. Each dot represents an individual tumor (2-sided Pearson correlation p-value). f. MPI and Ki-67 fractions per TMA core (mean of n = 35, 15, 17, 18, and 24 total cores, 2-sided t-test p-value). g. ccD-CMD plots from individual MCF-7 xenografts tumors (4000 cells per mouse, n=12, 6, 6, 6, 8 mice).
