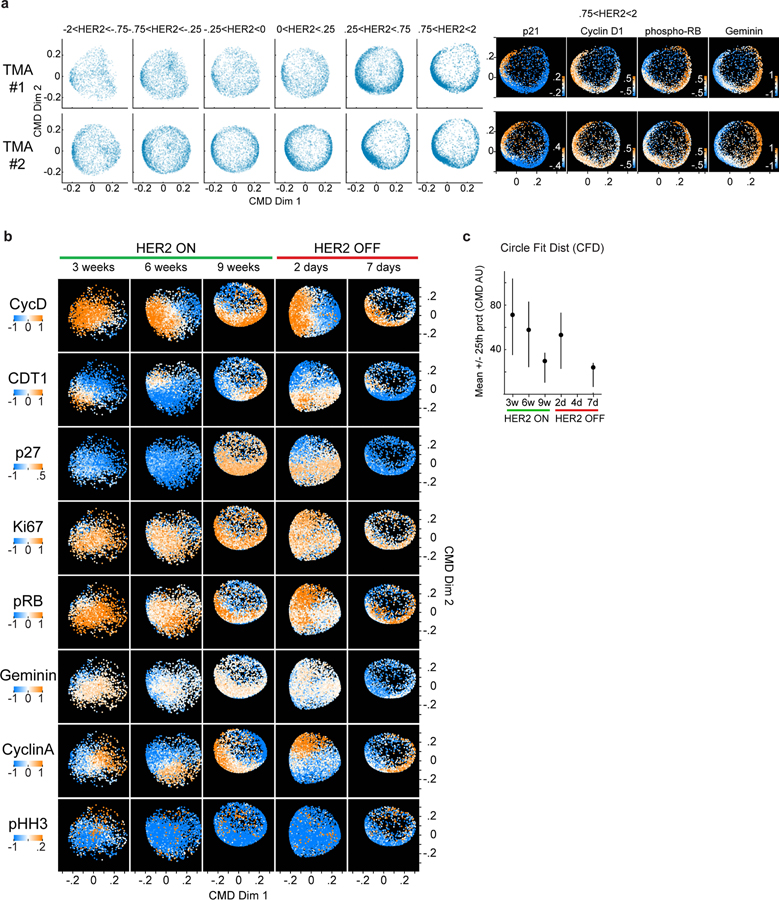
Extended Data Fig. 8: HER2 expression and cell cycle dynamics in human breast cancer tissues and HER2 driven mouse model of breast cancer.

a. ccD-CMD plots for two HER2+ breast cancer tissue microarrays (TMA # 1 and #2) for increasing levels for HER2 protein. Single cells binned by normalized HER2 levels (n = 5,000 cells per bin were used). Right, ccD-CMD scatter plots of highest HER2 bin for both TMA1 and 2 with single marker normalized intensities mapped to color (n = 5,000 cells). b. ccD-CMD scatter plots of the single-cell data from MPI +1 cells from time course of HER2 induction and repression in GEMM with single marker normalized intensities mapped to color (n = 5,000 cells per plot, p27 was not used by the ccD-CMD algorithm). c. Mean +/− 25th percentile of circle fit distance of cell cycle markers in tumor cells (in situ and invasive) from Fig. 5h (n = 5,000 cells per plot).
