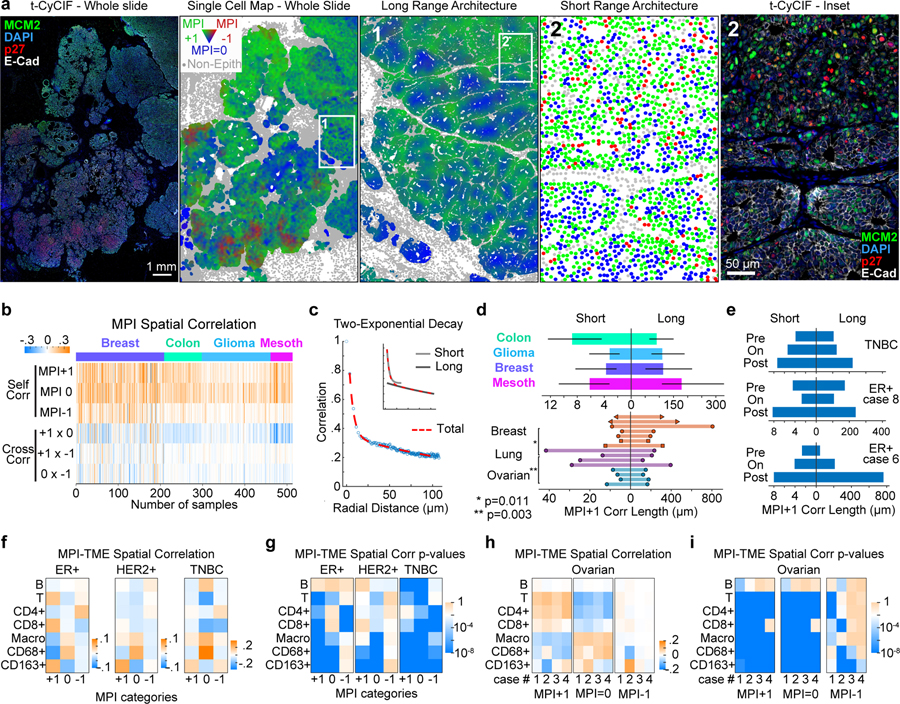
Figure 2. MPI reveals two proliferative domains of cancer proliferative architecture.

a. Spatial maps of MPI categories (the whole slide and inset 1 were smoothed over 40 neighboring cells, for visualization purposes only) and corresponding composite CyCIF images (left) from a HER2-positive breast tumor (white = E-Cadherin, green = MCM2, red = p27, blue = DNA). b. Heat map of spatial correlations within and across MPI categories (“self corr” and “cross corr” respectively, k = 5th neighbor, n = 513 samples). c. Spatial correlation plot and two-exponential fit. Inset depicts the two exponential curves that composed the fit (“short “and “long” scales). d. Spatial correlation decay lengths for multiple cancer types (n = 53 breast, 73 colon carcinoma, 122 glioma, 32 mesothelioma samples from four tissue microarrays; median +/− 25th percentile) and 15 whole slide cancer tissues (7 breast, 4 lung, 4 ovarian). e. Spatial correlation lengths through treatment (see Supplementary Table 4 for details). f-i. Spatial correlation between epithelial tumor cells and immune cells (f and h), and corresponding p-values (g and i) for breast cancer cohort (ER+ n = 46, HER2+ n = 37, TNBC n = 18 samples, Pantomics BRC15010) and individual ovarian whole tumor slides (n = 4). Pearson correlation p-values are displayed in log10 color scale.
